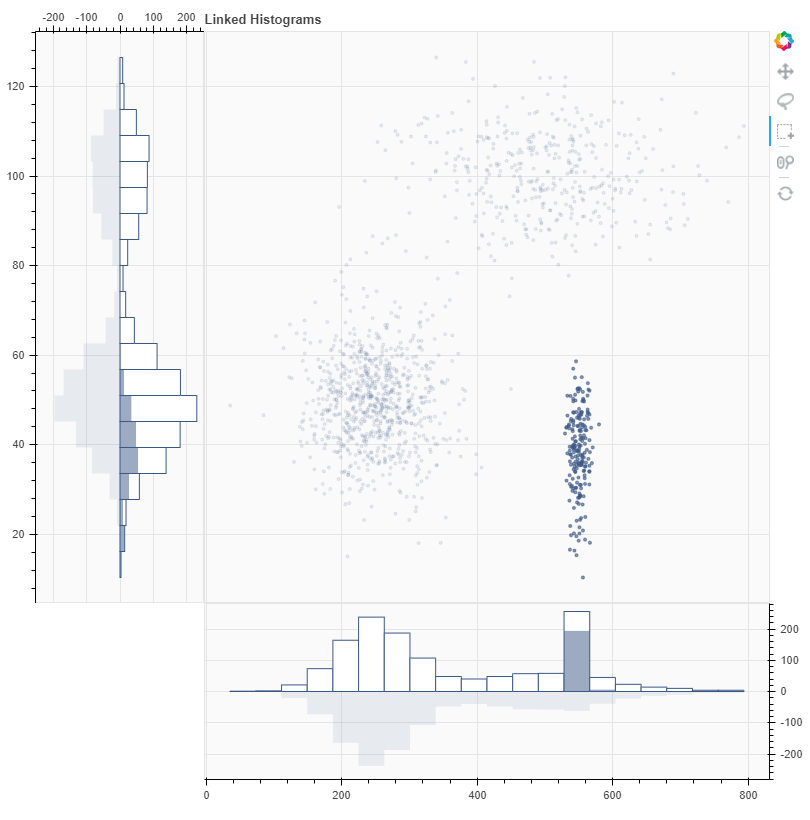
That makes sense, thank you! Once I moved the axes to the edges of the grid I got this result.
Putting that together with setting the figure min_border to zero, either using the kwarg or using the attribute directly p.min_border(0), I was able to remove all the space and get it to look how I wanted.
FWIW, here is the final code (which I will be adapting for my actual use case).
''' Present a scatter plot with linked histograms on both axes.

Use the ``bokeh serve`` command to run the example by executing:

    bokeh serve selection_histogram.py

at your command prompt. Then navigate to the URL

    http://localhost:5006/selection_histogram

in your browser.

'''

import numpy as np

from bokeh.layouts import gridplot
from bokeh.models import BoxSelectTool, LassoSelectTool
from bokeh.plotting import curdoc, figure

# create three normal population samples with different parameters
x1 = np.random.normal(loc=5.0, size=400) * 100
y1 = np.random.normal(loc=10.0, size=400) * 10

x2 = np.random.normal(loc=5.0, size=800) * 50
y2 = np.random.normal(loc=5.0, size=800) * 10

x3 = np.random.normal(loc=55.0, size=200) * 10
y3 = np.random.normal(loc=4.0, size=200) * 10

x = np.concatenate((x1, x2, x3))
y = np.concatenate((y1, y2, y3))

TOOLS = "pan,wheel_zoom,box_select,lasso_select,reset"

# create the scatter plot
p = figure(tools=TOOLS, plot_width=600, plot_height=600, min_border=0,
           x_axis_location=None, y_axis_location=None,
           title="Linked Histograms")
p.background_fill_color = "#fafafa"
p.select(BoxSelectTool).select_every_mousemove = False
p.select(LassoSelectTool).select_every_mousemove = False

r = p.scatter(x, y, size=3, color="#3A5785", alpha=0.6)

# create the horizontal histogram
hhist, hedges = np.histogram(x, bins=20)
hzeros = np.zeros(len(hedges)-1)
hmax = max(hhist)*1.1

LINE_ARGS = dict(color="#3A5785", line_color=None)
BK_COLOR = "#fafafa"

ph = figure(toolbar_location=None, plot_width=p.plot_width, plot_height=200,
            x_range=p.x_range, y_range=(-hmax, hmax), y_axis_location='right',
            min_border=0)
ph.background_fill_color = BK_COLOR

ph.quad(bottom=0, left=hedges[:-1], right=hedges[1:], top=hhist, color="white",
        line_color="#3A5785")
hh1 = ph.quad(bottom=0, left=hedges[:-1], right=hedges[1:], top=hzeros,
              alpha=0.5, **LINE_ARGS)
hh2 = ph.quad(bottom=0, left=hedges[:-1], right=hedges[1:], top=hzeros,
              alpha=0.1, **LINE_ARGS)

# create the vertical histogram
vhist, vedges = np.histogram(y, bins=20)
vzeros = np.zeros(len(vedges)-1)
vmax = max(vhist)*1.1

pv = figure(toolbar_location=None, plot_width=200, plot_height=p.plot_height,
            x_range=(-vmax, vmax), y_range=p.y_range, x_axis_location='above',
            min_border=0)
pv.background_fill_color = BK_COLOR

pv.quad(left=0, bottom=vedges[:-1], top=vedges[1:], right=vhist, color="white",
        line_color="#3A5785")
vh1 = pv.quad(left=0, bottom=vedges[:-1], top=vedges[1:], right=vzeros,
              alpha=0.5, **LINE_ARGS)
vh2 = pv.quad(left=0, bottom=vedges[:-1], top=vedges[1:], right=vzeros,
              alpha=0.1, **LINE_ARGS)

layout = gridplot([[pv, p], [None, ph]], merge_tools=False)

curdoc().add_root(layout)
curdoc().title = "Selection Histogram"


def update(attr, old, new):
    inds = new
    if len(inds) == 0 or len(inds) == len(x):
        hhist1, hhist2 = hzeros, hzeros
        vhist1, vhist2 = vzeros, vzeros
    else:
        neg_inds = np.ones_like(x, dtype=np.bool)
        neg_inds[inds] = False
        hhist1, _ = np.histogram(x[inds], bins=hedges)
        vhist1, _ = np.histogram(y[inds], bins=vedges)
        hhist2, _ = np.histogram(x[neg_inds], bins=hedges)
        vhist2, _ = np.histogram(y[neg_inds], bins=vedges)

    hh1.data_source.data["top"] = hhist1
    hh2.data_source.data["top"] = -hhist2
    vh1.data_source.data["right"] = vhist1
    vh2.data_source.data["right"] = -vhist2


r.data_source.selected.on_change('indices', update)