First post here!
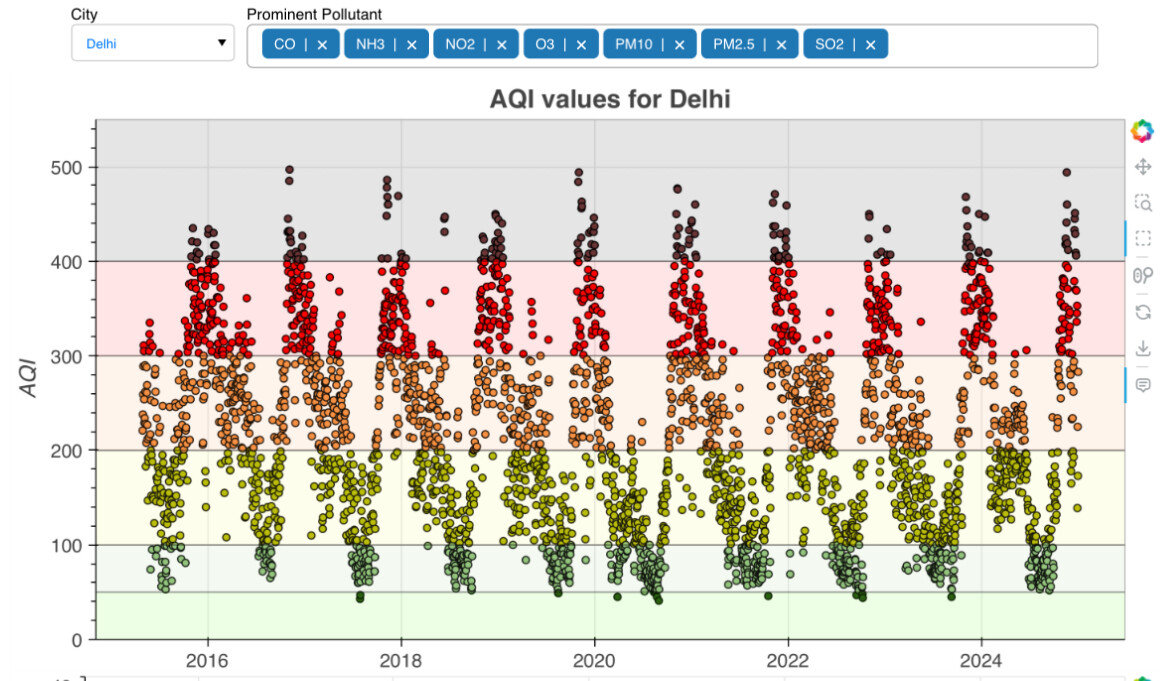
We’ve built a Bokeh data application to present AQI information from Indian cities. Part of a larger research project, but Bokeh helped in creating interactive visuals that a naked eye would miss.
Check it here: AQI Bulletins app
First post here!
We’ve built a Bokeh data application to present AQI information from Indian cities. Part of a larger research project, but Bokeh helped in creating interactive visuals that a naked eye would miss.
Check it here: AQI Bulletins app
Hey, looks great! What happend between 2018 and 2019?
This is really terrific thanks for sharing!
I don’t see anything special… could you please elaborate what you see?
@thechaoticneuron I think @mfe is referring to the bottom chart (not pictured above) that shows a dramatic increase in the number of stations around that time.