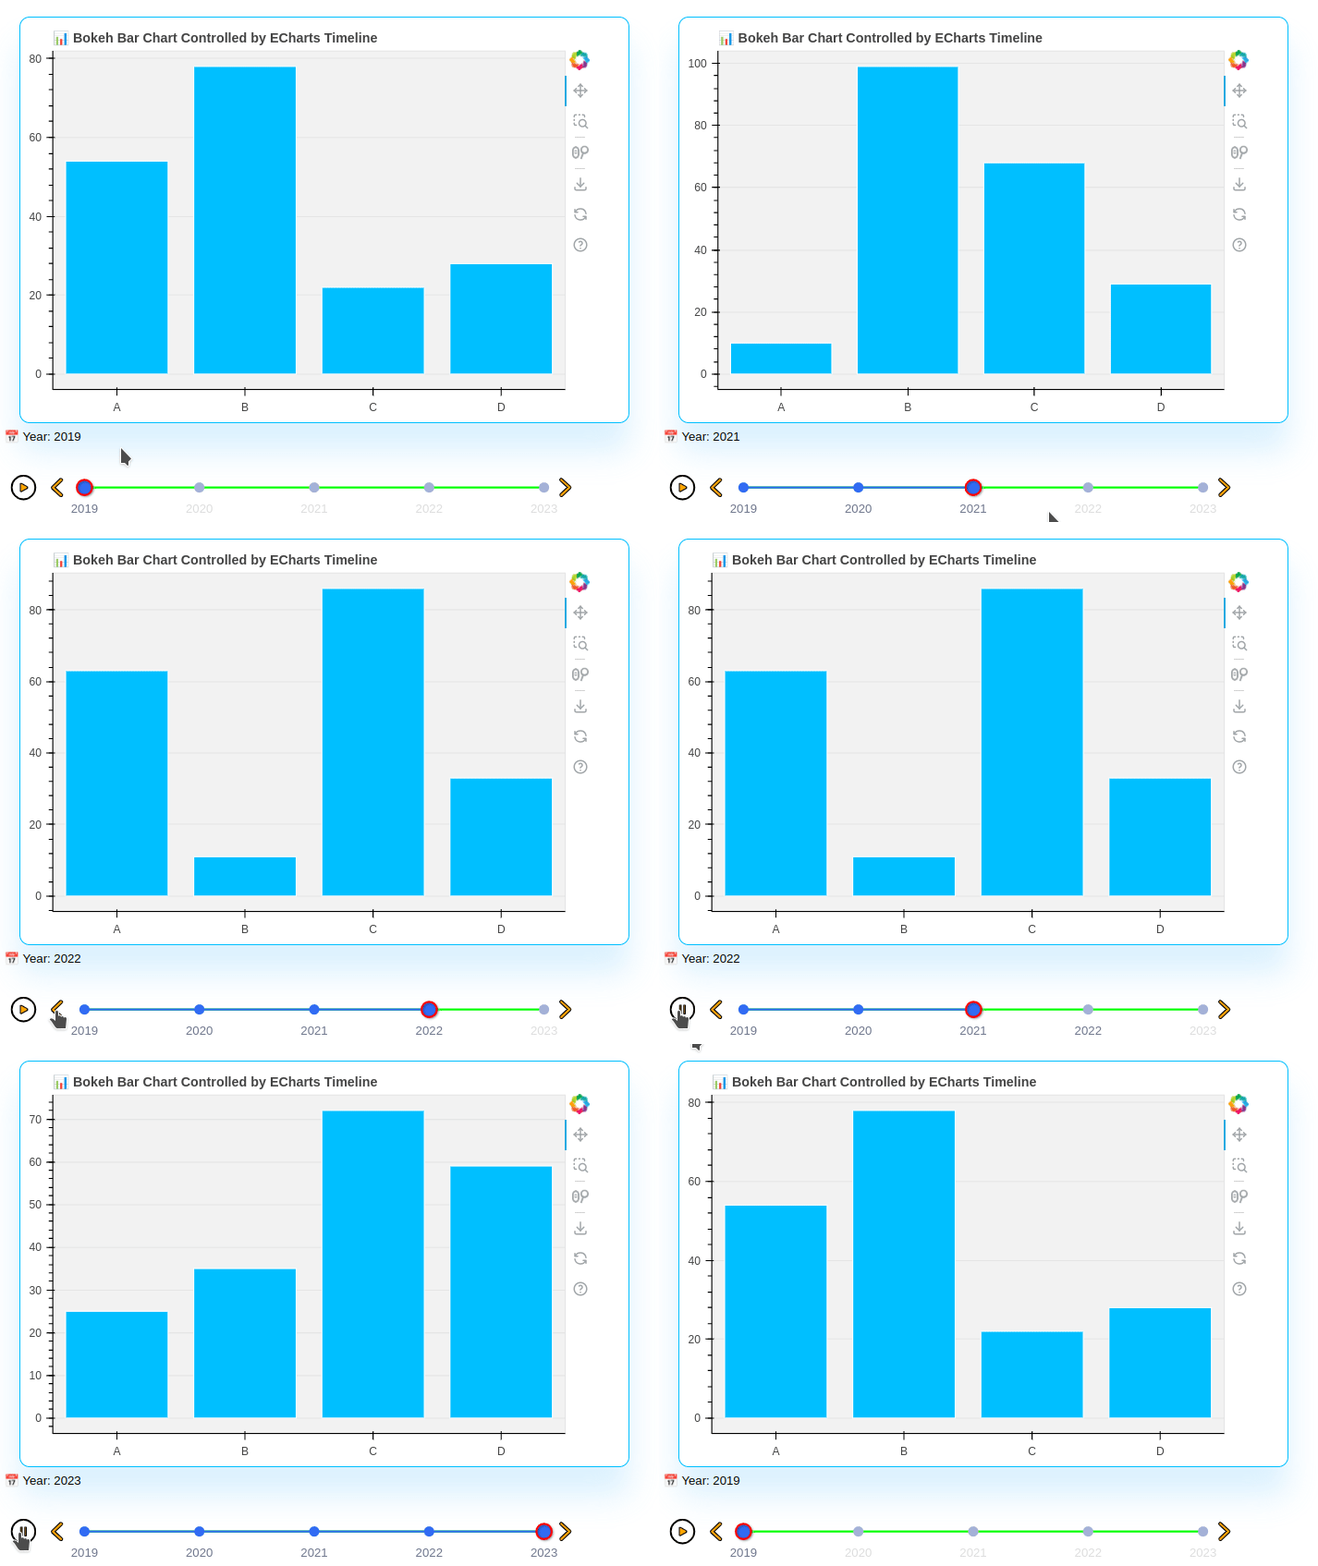
# main.py
import numpy as np
from bokeh.io import curdoc
from bokeh.layouts import column
from bokeh.models import ColumnDataSource, CustomJS, Paragraph
from bokeh.plotting import figure

# Timeline years and bar categories
YEARS = ['2019', '2020', '2021', '2022', '2023']
CATEGORIES = ['A', 'B', 'C', 'D']

# Fake bar data for each year
data_per_year = {
    year: np.random.randint(10, 100, size=len(CATEGORIES)).tolist()
    for year in YEARS
}

# Initial data source
source = ColumnDataSource(data=dict(
    x=CATEGORIES,
    top=data_per_year[YEARS[0]]
))

# Bar chart
p = figure(x_range=CATEGORIES, height=400, width=600,
           title="📊 Bokeh Bar Chart Controlled by ECharts Timeline",
           )

p.vbar(x='x', top='top', width=0.8, source=source, fill_color="#00bfff", line_color="white")
p.xgrid.grid_line_color = None

p.min_border_bottom=40; p.min_border_right=70;p.styles = {'margin-top': '20px','margin-left': '20px','border-radius': '10px','box-shadow': '0 28px 30px rgba(165, 221, 253, 0.4)','padding': '5px','background-color': 'white','border': '1px solid deepskyblue'}
p.background_fill_color = '#f2f2f2'

label = Paragraph(text=f"📅 Year: {YEARS[0]}")

# Inject ECharts timeline via pure JS
callback = CustomJS(args=dict(source=source, label=label), code=f"""
function loadECharts(cb) {{
    if (!window.echarts) {{
        const s = document.createElement('script');
        s.src = "https://cdn.jsdelivr.net/npm/[email protected]/dist/echarts.min.js";
        s.onload = cb;
        document.head.appendChild(s);
    }} else {{
        cb();
    }}
}}

function renderTimeline() {{
    const years = {YEARS};
    const values = {{
        {', '.join(f'"{y}": {data_per_year[y]}' for y in YEARS)}
    }};

    let div = document.getElementById("echarts_timeline");
    if (!div) {{
        div = document.createElement("div");
        div.id = "echarts_timeline";
        div.style = "position:fixed; bottom:350px; left:0px; height:200px; width:700px; background:none; z-index:9999;";
        document.body.appendChild(div);
    }}

    const chart = echarts.init(div);
    chart.setOption({{
        baseOption: {{
            timeline: {{
                data: years,
                axisType: 'category',
                autoPlay: false,
                playInterval: 2000,
                left: '1%',
                right: '10%',
                bottom: '3%',
                width: '80%',
                label: {{
                    normal: {{ textStyle: {{ color: '#ddd' }} }},
                    emphasis: {{ textStyle: {{ color: 'black' }} }}
                }},
                symbolSize: 10,
                lineStyle: {{ color: 'lime' }},
                checkpointStyle: {{
                    borderColor: 'red',
                    borderWidth: 2
                }},
                controlStyle: {{
                    showNextBtn: true,
                    showPrevBtn: true,
                    normal: {{
                        color: 'orange',
                        borderColor: 'black'
                    }},
                    emphasis: {{
                        color: 'red',
                        borderColor: 'red'
                    }}
                }}
            }},
            series: []
        }}
    }});

    chart.on('timelinechanged', function(e) {{
        const year = years[e.currentIndex];
        const data = {{ ...source.data }};
        data.top = values[year];
        source.data = data;
        label.text = `📅 Year: ${{year}}`;
    }});
}}

loadECharts(renderTimeline);
""")

curdoc().js_on_event('document_ready', callback)

curdoc().add_root(column(p, label))
curdoc().title = "ECharts Timeline + Bokeh Bars"
