Hello,
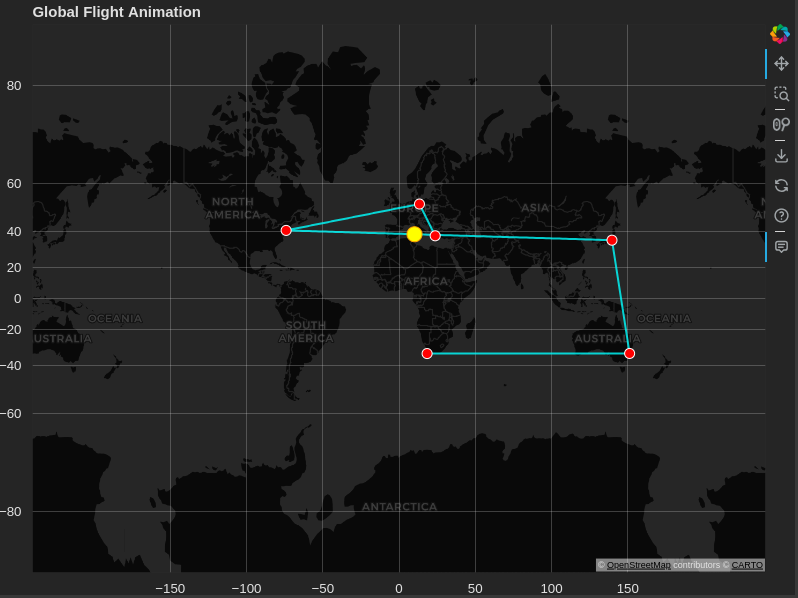
I was delighted when I figured out how to animate a point on a path on a map. Thanks to the powerful Bokeh ![]() .
.
from bokeh.plotting import figure, show
from bokeh.io import curdoc
from bokeh.models import ColumnDataSource, HoverTool, CustomJS
import numpy as np

# Generate city data
cities = [
    ("Athens", 37.9838, 23.7275),
    ("Berlin", 52.5200, 13.4050),
    ("New York", 40.7128, -74.0060),
    ("Tokyo", 35.6762, 139.6503),
    ("Sydney", -33.8688, 151.2093),
    ("Cape Town", -33.9249, 18.4241)
]

# Convert to Web Mercator coordinates
def convert_to_mercator(lons, lats):
    """Convert longitude/latitude to Web Mercator coordinates"""
    k = 6378137
    x = np.array(lons) * (k * np.pi / 180.0)
    y = np.log(np.tan((90 + np.array(lats)) * np.pi / 360.0)) * k
    return x, y

# City names, latitudes, and longitudes
city_names = [city[0] for city in cities]
city_lats = [city[1] for city in cities]
city_lons = [city[2] for city in cities]

# Convert city coordinates to Web Mercator
city_x, city_y = convert_to_mercator(city_lons, city_lats)

# Create flight paths by connecting the cities
path_x = []
path_y = []
for i in range(len(city_x) - 1):
    path_x.extend(np.linspace(city_x[i], city_x[i+1], 100))
    path_y.extend(np.linspace(city_y[i], city_y[i+1], 100))

# Create the figure
p = figure(width=800, height=600,
           x_range=(-20000000, 20000000), y_range=(-20000000, 20000000),
           x_axis_type="mercator", y_axis_type="mercator",
           title="Global Flight Animation",
           background_fill_color='#252525',
           border_fill_color='#252525',
           outline_line_color=None)

# Add the tile source (CartoDB Dark Matter)
p.add_tile("CartoDB Dark Matter", retina=True)

# Create data source for cities
city_source = ColumnDataSource(data={
    'name': city_names,
    'x': city_x,
    'y': city_y
})

# Create data source for moving circle
circle_source = ColumnDataSource(data={
    'x': [city_x[0]],
    'y': [city_y[0]]
})

# Add flight paths (lines between cities)
p.line(path_x, path_y, line_color="cyan", line_width=2, line_alpha=0.8)

# Add cities as points
p.circle('x', 'y', size=10, fill_color="red", line_color="white", source=city_source)

# Add the moving circle
moving_circle = p.circle('x', 'y', size=15, fill_color="yellow", line_color="orange", source=circle_source)

# Add hover tool for cities
hover = HoverTool(tooltips=[("City", "@name")])
p.add_tools(hover)

# Add animation using CustomJS with setInterval
callback = CustomJS(args=dict(source=circle_source, path_x=path_x, path_y=path_y), code="""
    const data = source.data;
    const x = data['x'];
    const y = data['y'];
    const n = path_x.length;

    let idx = 0; // Starting index

    // Set the interval to move the circle every 100 ms
    setInterval(function() {
        // Update the circle's position
        x[0] = path_x[idx];
        y[0] = path_y[idx];

        // Update the index to move the circle along the path
        idx = (idx + 1) % n;

        // Emit the change
        source.change.emit();
    }, 100);  // Update every 100 milliseconds
""")

# Add plot to document and trigger animation
doc = curdoc()
doc.add_root(p)
doc.js_on_event('document_ready', callback)

# Show the plot
show(p)