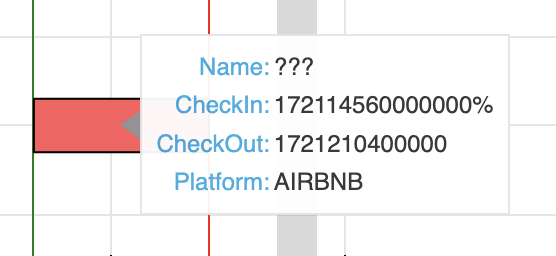
I’m banging my head trying to get my tooltip to show day-month-year. What I need is a complete example plot/code to get past this. I THINK I’m following the documentation, but I’m not getting anywhere. I must be missing something basic. Thanks in advance.
I gotchu
from bokeh.models import ColumnDataSource, HoverTool
from bokeh.plotting import figure, save
import pandas as pd
df=pd.DataFrame(data = {'Item':['A','B'],'x':[10,11],'y':[6,12],'Date':['Jan 1, 2018','Jan 2, 2018']})
df['Date'] = pd.to_datetime(df['Date'])
src = ColumnDataSource(df)
p = figure()
r = p.scatter(x='x',y='y',size=8,source=src)
hvr = HoverTool(renderers=[r]
,tooltips=[('dt','@Date{%d/%m/%Y}')] # see --> https://www.w3schools.com/python/python_datetime.asp
,formatters={'@Date':'datetime'})
p.add_tools(hvr)
save(p,'test.html')
2 Likes
Yes, this is perfect, Gaelen. Thank you!
This topic was automatically closed 90 days after the last reply. New replies are no longer allowed.