from bokeh.plotting import figure, show, output_file
from bokeh.models import Label, HoverTool, ColumnDataSource, CustomJS, TapTool, GlobalInlineStyleSheet
from bokeh.layouts import row
import numpy as np
def get_dark_stylesheet():
"""Create a new dark theme stylesheet instance."""
return GlobalInlineStyleSheet(css="""
html, body, .bk, .bk-root {
background-color: #2b2b2b;
margin: 0;
padding: 0;
height: 100%;
color: white;
font-family: 'Consolas', 'Courier New', monospace;
}
.bk { color: white; }
""")
def get_light_stylesheet():
"""Create a new light theme stylesheet instance."""
return GlobalInlineStyleSheet(css="""
html, body, .bk, .bk-root {
background-color: #f5f5f5;
margin: 0;
padding: 0;
height: 100%;
color: black;
font-family: 'Consolas', 'Courier New', monospace;
}
.bk { color: black; }
""")
def plot_arc_diagram(nodes, edges, node_colors=None, edge_weights=None,
title='Arc Diagram', width=1200, height=800,
node_size=15, arc_height_scale=1.5,
dark_bg=True, show_labels=True):
"""
Create an enhanced arc diagram with click-to-filter interactivity.
Parameters:
-----------
nodes : list
List of node names/labels
edges : list of tuples
List of (source, target) pairs where source and target are node indices
node_colors : list, optional
Colors for each node
edge_weights : list, optional
Weights for each edge (affects arc thickness)
title : str
Chart title
width, height : int
Figure dimensions
node_size : int
Size of node circles
arc_height_scale : float
Scale factor for arc heights
dark_bg : bool
Use dark background theme
show_labels : bool
Show node labels
Returns:
--------
bokeh figure object
"""
bg_color = '#2b2b2b' if dark_bg else '#f5f5f5'
text_color = 'white' if dark_bg else 'black'
n_nodes = len(nodes)
# Default colors
if node_colors is None:
node_colors = ['#3498db'] * n_nodes
# Normalize edge weights
if edge_weights is None:
edge_weights = [1.0] * len(edges)
else:
max_weight = max(edge_weights)
edge_weights = [w / max_weight for w in edge_weights]
# Create figure
p = figure(
width=width,
height=height,
title=title,
toolbar_location='right',
tools='pan,wheel_zoom,reset,save',
background_fill_color=bg_color,
border_fill_color=bg_color,
x_range=(-0.5, n_nodes - 0.5),
y_range=(-0.2, 1.1)
)
# Styling
p.title.text_color = text_color
p.title.text_font_size = '18pt'
p.title.text_font_style = 'bold'
p.xaxis.visible = False
p.yaxis.visible = False
p.xgrid.visible = False
p.ygrid.visible = False
p.outline_line_color = None
# Node positions
node_positions = list(range(n_nodes))
# Store edge data for JavaScript callback
edge_sources = []
edge_node_pairs = []
# Draw arcs (edges)
for idx, ((source, target), weight) in enumerate(zip(edges, edge_weights)):
if source == target:
continue
original_source = source
original_target = target
# Ensure source < target for arc direction
if source > target:
source, target = target, source
# Arc parameters
x_start = node_positions[source]
x_end = node_positions[target]
x_mid = (x_start + x_end) / 2
span = abs(x_end - x_start)
# Arc height
arc_height = span / (2 * n_nodes) * arc_height_scale
# Generate arc points
n_points = max(50, int(span * 8))
t = np.linspace(0, np.pi, n_points)
x_arc = x_mid + (span / 2) * np.cos(t)
y_arc = arc_height * np.sin(t)
# Arc styling
arc_color = node_colors[original_source]
arc_alpha = 0.6
arc_width = 2 + 4 * weight
# Create data source with alpha control
edge_data = ColumnDataSource(data=dict(
x=x_arc,
y=y_arc,
edge_info=[f"{nodes[original_source]} → {nodes[original_target]}"] * len(x_arc),
weight_info=[f"Weight: {weight:.2f}"] * len(x_arc)
))
# Draw arc
renderer = p.line(
'x', 'y',
source=edge_data,
color=arc_color,
line_alpha=arc_alpha,
line_width=arc_width,
name=f'edge_{idx}'
)
edge_sources.append(edge_data)
edge_node_pairs.append([original_source, original_target])
# Add edge hover
edge_hover = HoverTool(
tooltips=[
("Connection", "@edge_info"),
("Weight", "@weight_info")
],
mode='mouse',
line_policy='nearest'
)
p.add_tools(edge_hover)
# Create node data source
node_source = ColumnDataSource(data=dict(
x=node_positions,
y=[0] * n_nodes,
names=nodes,
colors=node_colors,
size=[node_size] * n_nodes,
alpha=[1.0] * n_nodes
))
# Draw nodes
nodes_renderer = p.circle(
'x', 'y',
size='size',
source=node_source,
color='colors',
fill_alpha='alpha',
line_color='white' if dark_bg else 'black',
line_width=2.5,
name='nodes'
)
# Add node hover - ONLY for nodes, placed AFTER edge hover
node_hover = HoverTool(
renderers=[nodes_renderer],
tooltips=[("Node", "@names")],
mode='mouse',
point_policy='snap_to_data'
)
p.add_tools(node_hover)
# Store original edge widths
edge_widths = [2 + 4 * w for w in edge_weights]
# JavaScript callback for click interaction
callback = CustomJS(
args=dict(
node_source=node_source,
edge_sources=edge_sources,
edge_pairs=edge_node_pairs,
edge_widths=edge_widths,
base_node_size=node_size
),
code="""
const indices = node_source.selected.indices;
if (indices.length > 0) {
const clicked = indices[0];
// Update edges
for (let i = 0; i < edge_sources.length; i++) {
const edge = edge_sources[i];
const [src, tgt] = edge_pairs[i];
// Get current renderer
const renderers = Bokeh.documents[0].roots()[0].renderers;
const edge_renderer = renderers.find(r => r.name === 'edge_' + i);
if (edge_renderer) {
if (src === clicked || tgt === clicked) {
// Highlight connected edges - keep original width
edge_renderer.glyph.line_alpha = 0.95;
} else {
// Dim unconnected edges
edge_renderer.glyph.line_alpha = 0.08;
}
}
}
// Update nodes
const node_alphas = node_source.data['alpha'];
const node_sizes = node_source.data['size'];
for (let i = 0; i < node_alphas.length; i++) {
if (i === clicked) {
node_alphas[i] = 1.0;
node_sizes[i] = base_node_size * 1.5;
} else {
// Check if node is connected to clicked node
let connected = false;
for (let j = 0; j < edge_pairs.length; j++) {
const [src, tgt] = edge_pairs[j];
if ((src === clicked && tgt === i) || (tgt === clicked && src === i)) {
connected = true;
break;
}
}
node_alphas[i] = connected ? 1.0 : 0.2;
node_sizes[i] = connected ? base_node_size * 1.15 : base_node_size * 0.8;
}
}
node_source.change.emit();
} else {
// Reset all to original state
for (let i = 0; i < edge_sources.length; i++) {
const renderers = Bokeh.documents[0].roots()[0].renderers;
const edge_renderer = renderers.find(r => r.name === 'edge_' + i);
if (edge_renderer) {
edge_renderer.glyph.line_alpha = 0.6;
edge_renderer.glyph.line_width = edge_widths[i];
}
}
const node_alphas = node_source.data['alpha'];
const node_sizes = node_source.data['size'];
for (let i = 0; i < node_alphas.length; i++) {
node_alphas[i] = 1.0;
node_sizes[i] = base_node_size;
}
node_source.change.emit();
}
"""
)
# Add tap tool
tap = TapTool(renderers=[nodes_renderer], callback=callback)
p.add_tools(tap)
# Add a deselection callback to reset when clicking background
deselect_callback = CustomJS(
args=dict(
node_source=node_source,
edge_sources=edge_sources,
edge_widths=edge_widths,
base_node_size=node_size
),
code="""
const indices = cb_obj.indices;
if (indices.length === 0) {
// Reset all edges when deselected
for (let i = 0; i < edge_sources.length; i++) {
const renderers = Bokeh.documents[0].roots()[0].renderers;
const edge_renderer = renderers.find(r => r.name === 'edge_' + i);
if (edge_renderer) {
edge_renderer.glyph.line_alpha = 0.6;
edge_renderer.glyph.line_width = edge_widths[i];
}
}
// Reset all nodes to original size and alpha
const node_alphas = node_source.data['alpha'];
const node_sizes = node_source.data['size'];
for (let i = 0; i < node_alphas.length; i++) {
node_alphas[i] = 1.0;
node_sizes[i] = base_node_size;
}
node_source.change.emit();
}
"""
)
node_source.selected.js_on_change('indices', deselect_callback)
# Add labels
if show_labels:
for i, (pos, label) in enumerate(zip(node_positions, nodes)):
label_obj = Label(
x=pos, y=-0.08,
text=label,
text_color=text_color,
text_font_size='10pt',
text_align='center',
text_baseline='top',
angle=np.pi/4
)
p.add_layout(label_obj)
return p
def create_sample_network(network_type='simple'):
"""Create sample network data."""
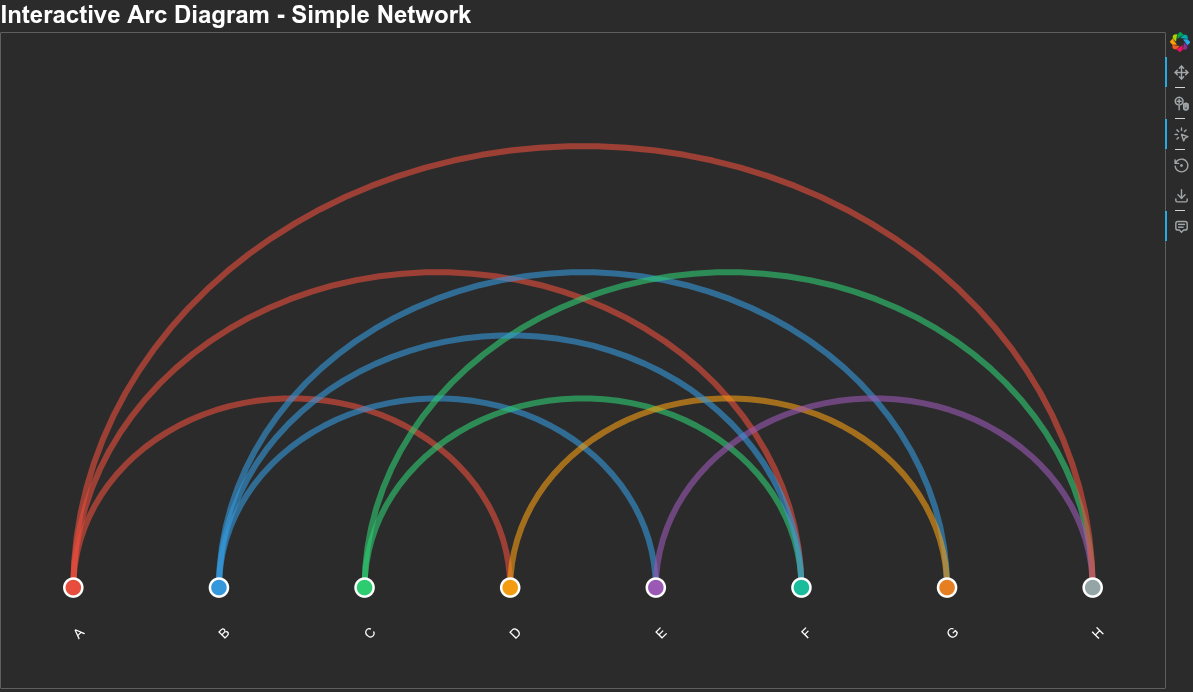
if network_type == 'simple':
nodes = ['A', 'B', 'C', 'D', 'E', 'F', 'G', 'H']
edges = [(0, 3), (0, 5), (1, 4), (1, 6), (2, 5), (2, 7),
(3, 6), (4, 7), (0, 7), (1, 5)]
colors = ['#e74c3c', '#3498db', '#2ecc71', '#f39c12',
'#9b59b6', '#1abc9c', '#e67e22', '#95a5a6']
weights = None
elif network_type == 'social':
nodes = ['Alice', 'Bob', 'Carol', 'Dave', 'Eve', 'Frank', 'Grace', 'Henry', 'Iris', 'Jack']
edges = [(0, 1), (0, 2), (0, 5), (1, 3), (1, 4), (2, 3), (2, 6),
(3, 7), (4, 5), (4, 8), (5, 9), (6, 7), (7, 9), (8, 9), (1, 6)]
colors = ['#3498db'] * len(nodes)
weights = [3, 5, 2, 4, 3, 5, 2, 3, 4, 2, 3, 4, 5, 3, 2]
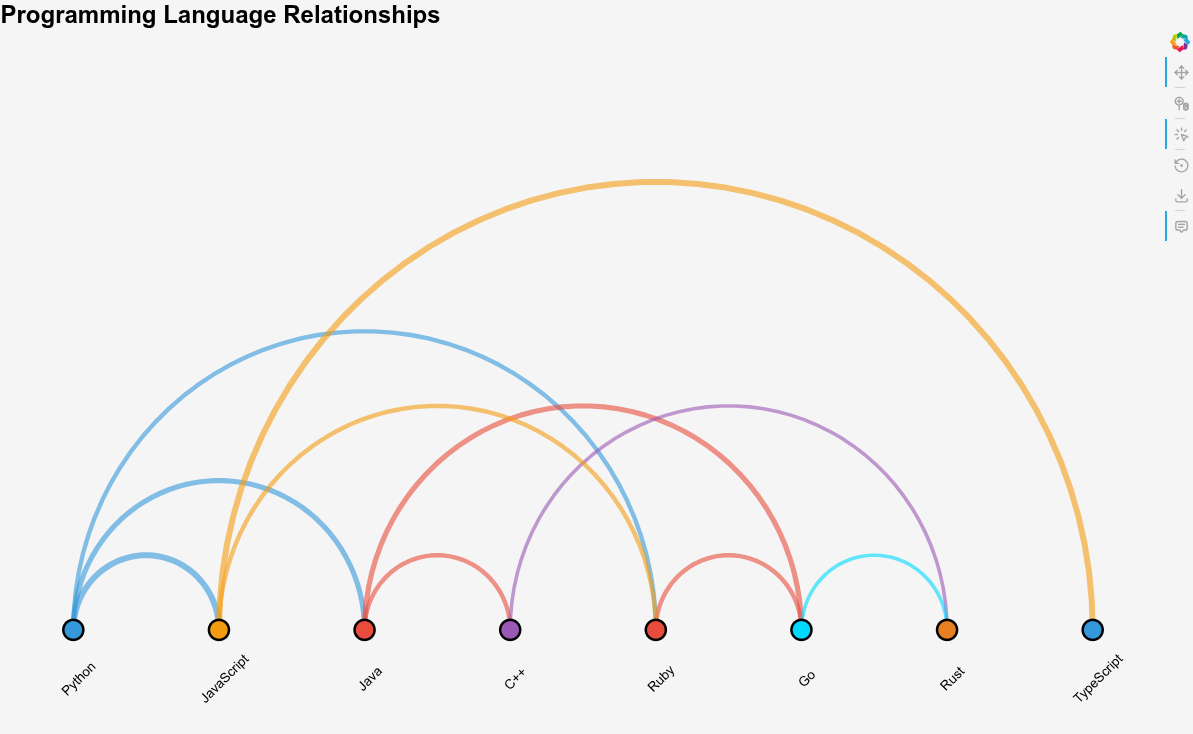
elif network_type == 'tech':
nodes = ['Python', 'JavaScript', 'Java', 'C++', 'Ruby', 'Go', 'Rust', 'TypeScript']
edges = [(0, 1), (0, 2), (0, 4), (1, 7), (2, 3), (2, 5), (3, 6), (4, 5), (5, 6), (1, 4)]
colors = ['#3498db', '#f39c12', '#e74c3c', '#9b59b6',
'#e74c3c', '#00d9ff', '#e67e22', '#3498db']
weights = [5, 4, 3, 5, 3, 4, 2, 3, 2, 3]
return nodes, edges, colors, weights
# ============================================================================
# EXAMPLES
# ============================================================================
if __name__ == "__main__":
from bokeh.io import reset_output
# Example 1: Simple Network (Dark Theme)
print("Example 1: Simple Network - Click nodes to filter!")
reset_output()
nodes, edges, colors, weights = create_sample_network('simple')
arc1 = plot_arc_diagram(
nodes=nodes,
edges=edges,
node_colors=colors,
title='Interactive Arc Diagram - Simple Network',
width=1200,
height=700,
arc_height_scale=2,
node_size=18
)
output_file("arc1_simple.html")
show(arc1, browser=None)
# Example 2: Social Network (Dark Theme)
print("\nExample 2: Social Network")
reset_output()
nodes, edges, colors, weights = create_sample_network('social')
arc2 = plot_arc_diagram(
nodes=nodes,
edges=edges,
node_colors=colors,
edge_weights=weights,
title='Interactive Arc Diagram - Social Network',
width=1400,
height=800,
node_size=16,
arc_height_scale=3
)
output_file("arc2_social.html")
show(arc2, browser=None)
# Example 3: Tech Stack (Light Theme)
print("\nExample 3: Programming Languages (Light Theme)")
reset_output()
nodes, edges, colors, weights = create_sample_network('tech')
arc3 = plot_arc_diagram(
nodes=nodes,
edges=edges,
node_colors=colors,
edge_weights=weights,
title='Programming Language Relationships',
width=1200,
height=750,
node_size=20,
arc_height_scale=2.2,
dark_bg=False
)
output_file("arc3_tech_light.html")
show(arc3, browser=None)