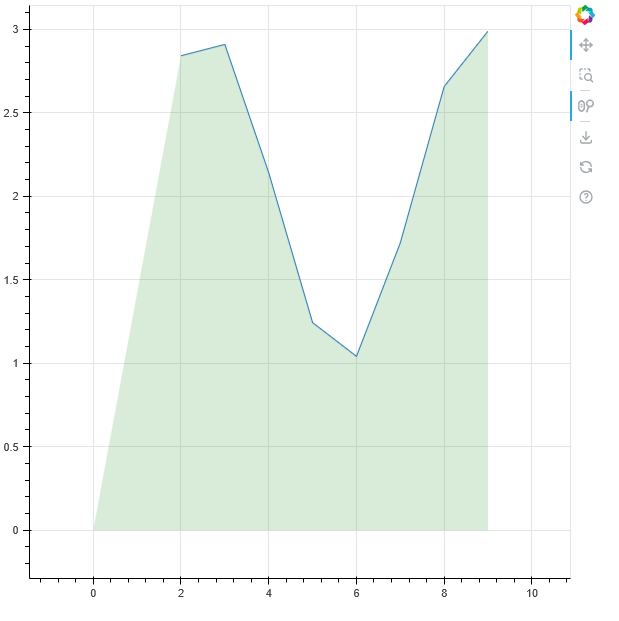
What is the expected behavior when using a Band when NaN values occur for the lower or upper value? Currently the band seems to collapse into the lower/upper value which is not missing. Naturally I would have expected that Band will not be drawn at all for such a lower/upper value combination. Of course the data can be cleaned upfront however having an option to control this behavior would be great.
import numpy as np
from bokeh.io import curdoc
from bokeh.models import ColumnDataSource, DataTable, DateFormatter, TableColumn, Band
from bokeh.plotting import figure

doc = curdoc()

n_rows = 10

data = dict(
        downloads=[np.sin(i)+2 for i in range(n_rows)],
        x=[i for i in range(n_rows)]
    )

data["downloads"][:1] = [np.nan, np.nan]

source = ColumnDataSource(data)

f = figure()
l = f.line(x="x", y="downloads", source=source)
s2_band = Band(base="x", lower=0, upper="downloads", source=source,
               level='underlay', fill_alpha=0.15, fill_color="green")
f.add_layout(s2_band)

doc.add_root(f)