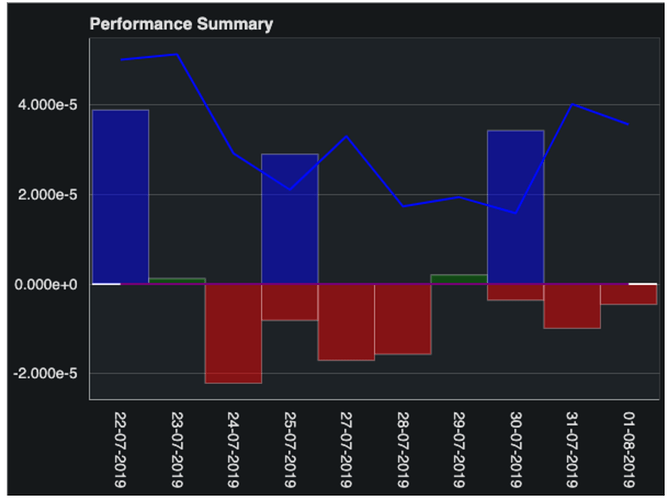
Bar chart, side by side rather than overlap

Hi guys, got sick of trying to get plotly to play nice and ended up here. Trying Bokeh for the first time and need a little guidance please. I’ve manage to do a bar chart with a line graph but can’t work out how to not have the bars overlap. I want them side by side for each day.

Also, how can I put like a dark theme on the chart and force x axis value to be at 90 degrees so looks a little neater when there are a lot of them

?

It looks like you are using date strings as categorical factors? (It’s always good to include some real code to focus questions). If so, you can make the bars narrower by adjusting their width A width of 1 means “span the entire category” so you can adjust that up or down to take up more or less space within each category. Or if you just want to highlight a narrow to border, have the smallest visual indication of separation, you can set, e.g line_color="white". Maybe this is actually the most appropriate, as all that is overlapping in this case is the border/outline of the bars.

There are examples of both in the Handling Categorical Data section.

There is a property to control tick label orientation:

Styling Visual Attributes — Bokeh 1.3.1 documentation

“Setting a theme” is a matter of just setting all the properties you want, to be how they want. There is a bokeh.theme module that can bundle up a bunch of property settings to make them easily re-usable. There are also a couple of built-int themes, including DARK_MINIMAL

1 Like

Great thank you so much. Was able to get most of that working except, bars are still on top of each other?

# Bokeh Chart
output_file("bar_mixed.html")
curdoc().theme = 'dark_minimal'
p = figure(x_range=report01data.xcords, plot_height=450, toolbar_location=None, title="Performance Summary")
# Draw bar graph
p.vbar(x=report01data.xcords, top=report01data.bar1, width=1, color="green", line_color="white", alpha=0.5)
p.vbar(x=report01data.xcords, top=report01data.bar2, width=1, color='red', line_color="white", alpha=0.5)
p.vbar(x=report01data.xcords, top=report01data.bar3, width=1, color="yellow", line_color="white", alpha=0.5)
p.vbar(x=report01data.xcords, top=report01data.bar4, width=1, color="blue", line_color="white", alpha=0.5)
p.vbar(x=report01data.xcords, top=report01data.bar5, width=1, color="cyan", line_color="white", alpha=0.5)
# Draw line graph
p.line(x=report01data.xcords, y=report01data.line1, color="blue", line_width=2)
p.line(x=report01data.xcords, y=report01data.line2, color="purple", line_width=2)

#p.y_range.start = 0
p.x_range.range_padding = 0.01
p.xaxis.major_label_orientation = "vertical"
p.xgrid.grid_line_color = None

show(p)

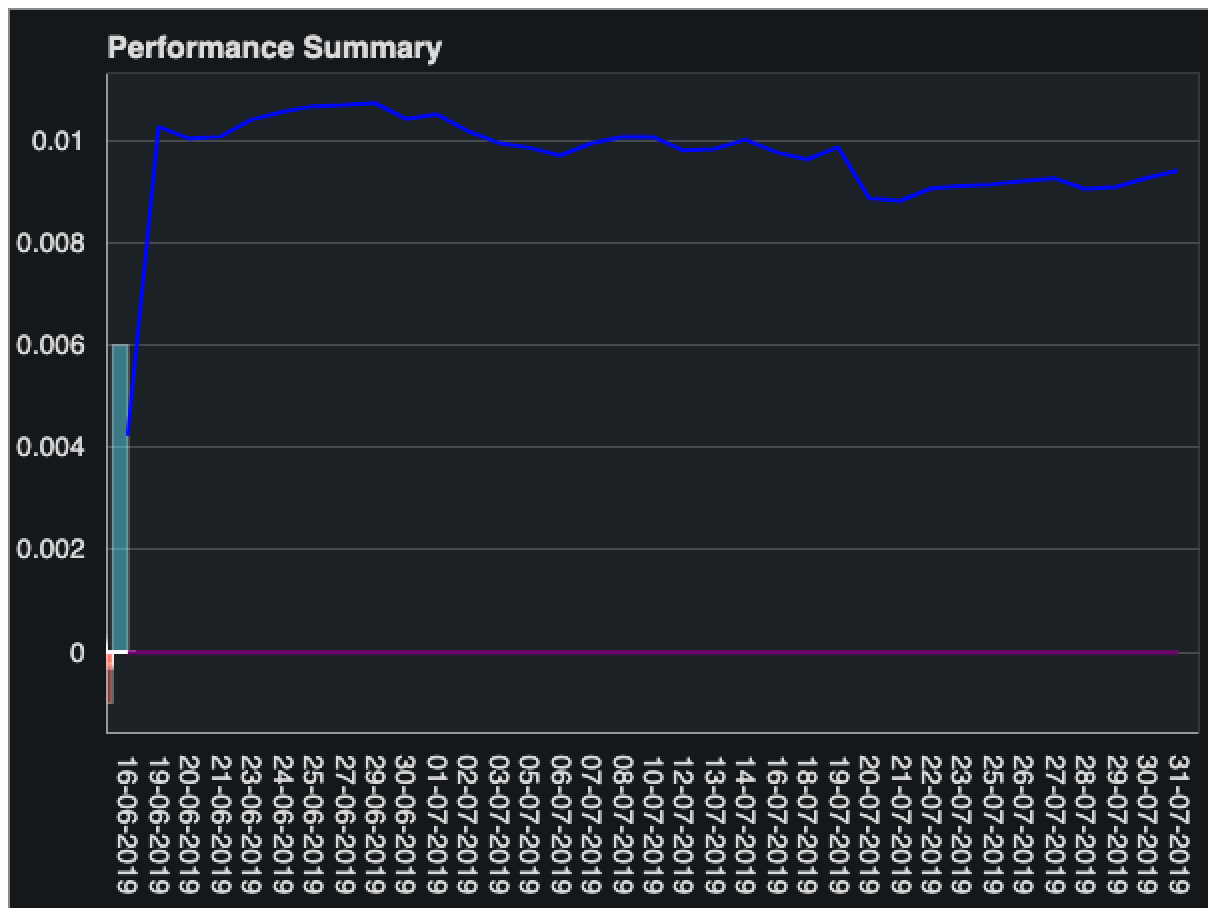
This is how I had it in plotly and want to do with Bokeh
report01

Ah, I misunderstood your question, I did not realize you meant literally in the vertical direction, I thought you meant adjacent bars were overlapping their areas. You will either need to apply explicit categorical offsets:

https://bokeh.pydata.org/en/latest/docs/user_guide/categorical.html#categorical-offsets

or (probably less work), use the dodge transform to shift some bars to the left, and others to the right:

https://bokeh.pydata.org/en/latest/docs/user_guide/categorical.html#visual-dodge

Either way it seems like you will also want to reduce the width of the bars by half, to accommodate two non-overlapping bars inside each category.

ooops

ValueError: expected an element of either String, Dict(Enum('expr', 'field', 'value', 'transform'), Either(String, Instance(Transform), Instance(Expression), Float)) or Float, got {'field': ['21-07-2019', '22-07-2019', '23-07-2019', '24-07-2019', '25-07-2019', '26-07-2019', '27-07-2019', '28-07-2019', '29-07-2019', '30-07-2019', '31-07-2019'], 'transform': Dodge(id='1034', ...)}

I was trying:

p.vbar(x=dodge(report01data.xcords, -0.25, range=p.x_range), top=report01data.bar1, width=1, color="#99F761", line_color="white", alpha=0.5)
p.vbar(x=dodge(report01data.xcords, -0.5, range=p.x_range), top=report01data.basr2, width=1, color="#F77461", line_color="white", alpha=0.5)

Right, dodge operates on ColumnDataSource columns, you can’t pass raw data to it, only the name of the column. See:

Providing Data for Plots and Tables — Bokeh 1.3.1 documentation

You’ll want to do this anyway to avoid duplicating all the x coordinates for every different glyph call.

Hmm ok understand. So if i have 5 different bars per day, does that mean i need 5 x data={}?

Or can a columndatasource handle multiple Y cols?

e.g.
data = { x_val: [ ], y1_val: [ ], y2_val: [ ], etc…]

Sorry, reading Handling categorical data — Bokeh 2.4.2 Documentation, it looks like it does.

Or can a columndatasource handle multiple Y cols?

Yes, a CDS can have as many columns as you like, as long as they are the exact same length. I generally would recommend putting all columns of the same length in to one CDS (with a unique column name for each).

Thanks, they are all the same length. I feel like I am so close now:

I think i have the side by side working now except, i’ve now lost the bars on the rest of the days.

# Bokeh Chart
output_file("bar_mixed.html")
curdoc().theme = 'dark_minimal'
bardata = {
    'x_values': report01data.xcords,
    'bar1': report01data.bar1,
    'bar2': report01data.bar2,
    'bar3': report01data.bar3,
    'bar4': report01data.bar4,
    'bar5': report01data.bar5
}
source = ColumnDataSource(data=bardata)
logger.info(bardata)
logger.info(source)

p = figure(x_range=report01data.xcords, plot_height=450, toolbar_location=None, title="Performance Summary")

# Draw bar graph
p.vbar(x=dodge('bar1', -0.5, range=p.x_range), top='bar1', width=0.5, color="#99F761", line_color="white", alpha=0.5, source=source)
p.vbar(x=dodge('bar2', -0.25, range=p.x_range), top='bar2', width=0.5, color="#F77461", line_color="white", alpha=0.5, source=source)
p.vbar(x=dodge('bar3', 0, range=p.x_range), top='bar3', width=0.5, color="#F4F761", line_color="white", alpha=0.5, source=source)
p.vbar(x=dodge('bar4', 0.25, range=p.x_range), top='bar4', width=0.5, color="#61E4F7", line_color="white", alpha=0.5, source=source)
p.vbar(x=dodge('bar5', 0.5, range=p.x_range), top='bar5', width=0.5, color="#BF61F7", line_color="white", alpha=0.5, source=source)
# Draw line graph
p.line(x=report01data.xcords, y=report01data.line1, color="blue", line_width=2)
p.line(x=report01data.xcords, y=report01data.line2, color="purple", line_width=2)

#p.y_range.start = 0
p.x_range.range_padding = 0.01
p.xaxis.major_label_orientation = "vertical"
p.xgrid.grid_line_color = None

show(p)

I should probably add those lines to the CDS too
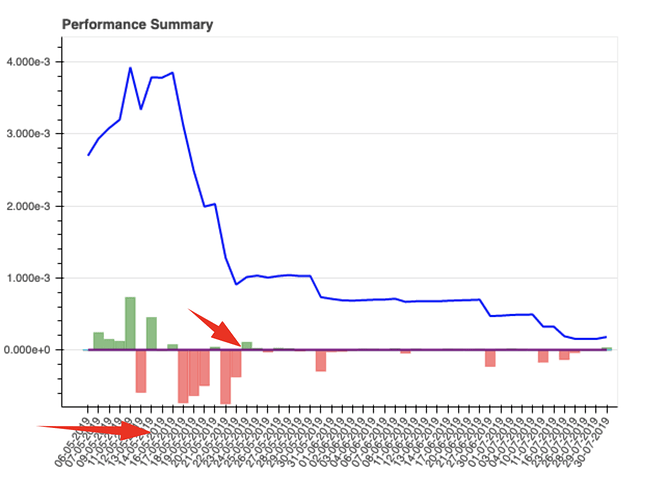
Oh i’m an idiot :crazy_face::crazy_face:

Of course it will all plot on the one day if i put my y co-ordinates on x lol

1 Like

Themes don’t seem to carry over to data tables. Is this correct or am I likely to be doing something wrong? Just trying to format the table headers

There are not many configurable properties for DataTable visuals at the moment. I think the only option for changing DataTable appearance is to apply CSS rules. You can add custom CSS classes to Bokeh objects by passing/setting a css_classes = [...] attribute, but you will need to have defined CSS stylesheets that target those classes, i.e. in a Jinja2 template. This is an area where the library can still use improvement.

Will that still work if all i am doing is creating/exporting the charts to PNG?

Will that still work if all i am doing is creating/exporting the charts to PNG?

It should. Bokeh’s PNG export works by rendering the page in a headless browser and programmatically taking a “screenshot”.

Great. Now to find a good tutorial for newcomers. Any recommendations?

@nogi There’s a pretty big set of tutorial notebooks available to run on MyBinder: