Great thank you so much. Was able to get most of that working except, bars are still on top of each other?
# Bokeh Chart
output_file("bar_mixed.html")
curdoc().theme = 'dark_minimal'
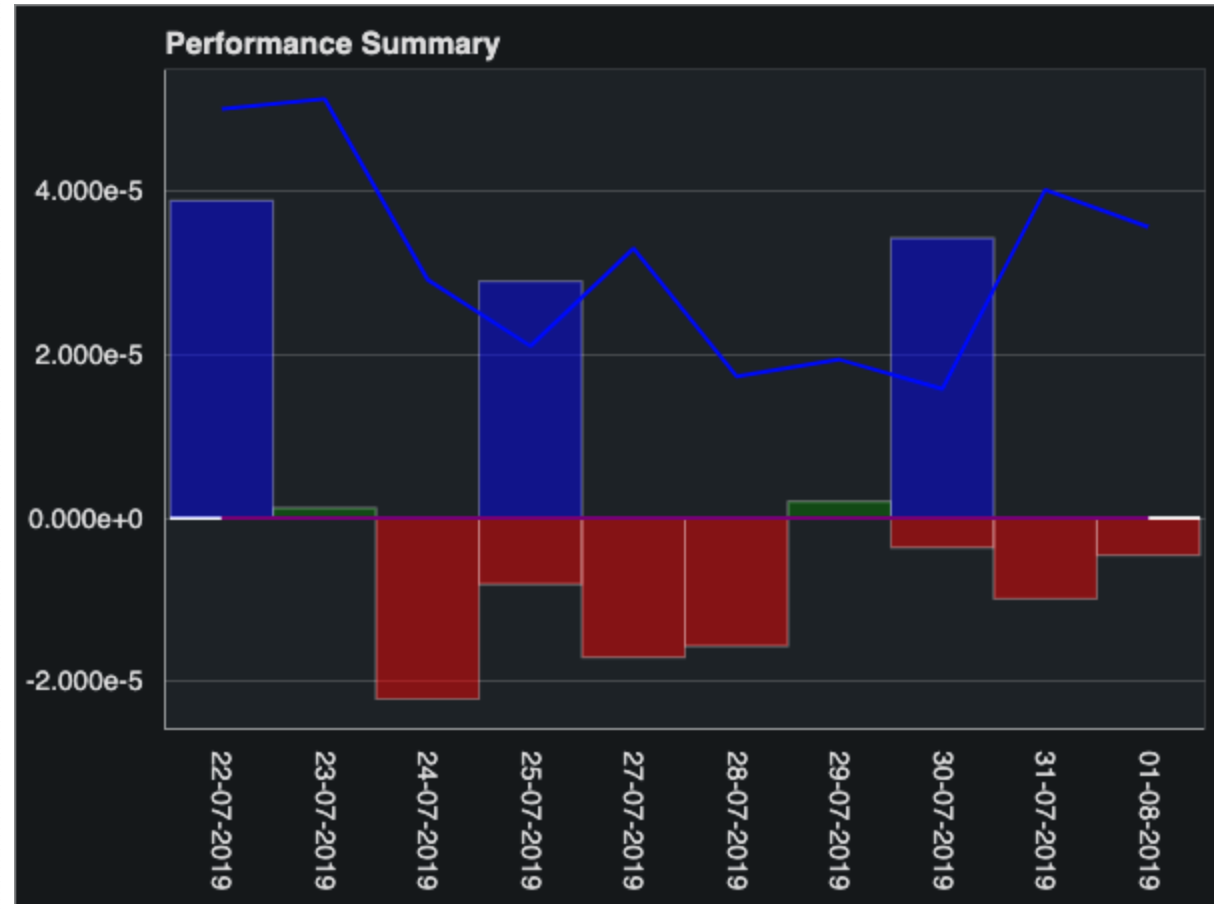
p = figure(x_range=report01data.xcords, plot_height=450, toolbar_location=None, title="Performance Summary")
# Draw bar graph
p.vbar(x=report01data.xcords, top=report01data.bar1, width=1, color="green", line_color="white", alpha=0.5)
p.vbar(x=report01data.xcords, top=report01data.bar2, width=1, color='red', line_color="white", alpha=0.5)
p.vbar(x=report01data.xcords, top=report01data.bar3, width=1, color="yellow", line_color="white", alpha=0.5)
p.vbar(x=report01data.xcords, top=report01data.bar4, width=1, color="blue", line_color="white", alpha=0.5)
p.vbar(x=report01data.xcords, top=report01data.bar5, width=1, color="cyan", line_color="white", alpha=0.5)
# Draw line graph
p.line(x=report01data.xcords, y=report01data.line1, color="blue", line_width=2)
p.line(x=report01data.xcords, y=report01data.line2, color="purple", line_width=2)
#p.y_range.start = 0
p.x_range.range_padding = 0.01
p.xaxis.major_label_orientation = "vertical"
p.xgrid.grid_line_color = None
show(p)