I am following this example to create my own bar chart.
I have pulled my data like this:
members = np.array([statdata[a][‘members’] for a in assocsort], dtype=np.float)
maxim = np.array([statdata[a][‘maxim’] for a in assocsort], dtype=np.float)
mean = np.array([statdata[a][‘mean’] for a in assocsort], dtype=np.float)
``
And have created the figure like the do in the example:
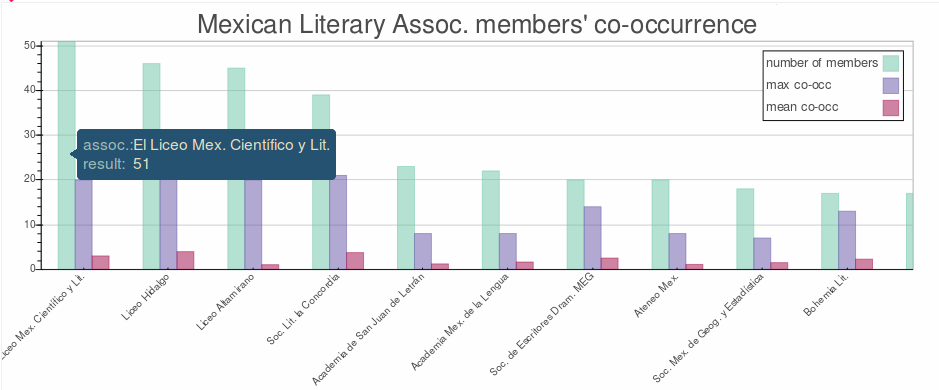
The problem is, I would like that the hover function would only show the bar-height values (see right.png) and not all the values along the y-axis (cf. wrong.png), but I am running out of ideas as for how to do it.
Any help you could provide me will be highly appreciated it!!
Do you mean the one with "result: 17" in the tooltip is wrong? I am assuming so, because I can't actually think of why it should display that. Perhaps a bug? Is there any way you can share a minimal complete example that reproduces the problem? That would go a long way towards helping us debug things.
I am following this example to create my own bar chart.
I have pulled my data like this:
members = np.array([statdata[a]['members'] for a in assocsort], dtype=np.float)
maxim = np.array([statdata[a]['maxim'] for a in assocsort], dtype=np.float)
mean = np.array([statdata[a]['mean'] for a in assocsort], dtype=np.float)
And have created the figure like the do in the example:
The problem is, I would like that the hover function would only show the bar-height values (see right.png) and not all the values along the y-axis (cf. wrong.png), but I am running out of ideas as for how to do it.
Any help you could provide me will be highly appreciated it!!
Hi Bryan! Thank you so much for your willingness to help me! “17” is all right if what you want is the value of the current point ( that is of where the mouse is currently hovering) but what I need is the highest value of the barchart (what some call "[data label](http://lilt.ilstu.edu/gmklass/pos138/datadisplay/sections/charts/3%20graphic%20data_files/image002.gif)"), which is`` stored in my **'**members’ np.array`.
On Friday, September 25, 2015 at 5:24:44 PM UTC+2, Bryan Van de ven wrote:
Hi Silvia,
Do you mean the one with “result: 17” in the tooltip is wrong? I am assuming so, because I can’t actually think of why it should display that. Perhaps a bug? Is there any way you can share a minimal complete example that reproduces the problem? That would go a long way towards helping us debug things.
The problem is, I would like that the hover function would only show the bar-height values (see right.png) and not all the values along the y-axis (cf. wrong.png), but I am running out of ideas as for how to do it.
Any help you could provide me will be highly appreciated it!!
Have a great day!
–
You received this message because you are subscribed to the Google Groups “Bokeh Discussion - Public” group.
To unsubscribe from this group and stop receiving emails from it, send an email to [email protected].
Oh, you want the height of each bar as the value? You need to use that column name in your tooltip template, not "$y" which just prints the y coordinated of the cursor. E.g., if the column that controls the height of the quad is "foo", then you want "@foo" to display the value of that column:
Thank you so much for your willingness to help me!
"17" is all right if what you want is the value of the current point ( that is of where the mouse is currently hovering) but what I need is the highest value of the barchart (what some call "data label"), which is stored in my 'members' np.array.
I just published my bar-chart so that you can take a look at it, and see what I mean
Have a nice day!
On Friday, September 25, 2015 at 5:24:44 PM UTC+2, Bryan Van de ven wrote:
Hi Silvia,
Do you mean the one with "result: 17" in the tooltip is wrong? I am assuming so, because I can't actually think of why it should display that. Perhaps a bug? Is there any way you can share a minimal complete example that reproduces the problem? That would go a long way towards helping us debug things.
Thanks,
Bryan
> On Sep 25, 2015, at 9:14 AM, silv...@gmail.com wrote:
>
> Dear all,
>
> [please excuse my newbieness]
>
> I am following this example to create my own bar chart.
>
> I have pulled my data like this:
>
> members = np.array([statdata[a]['members'] for a in assocsort], dtype=np.float)
> maxim = np.array([statdata[a]['maxim'] for a in assocsort], dtype=np.float)
> mean = np.array([statdata[a]['mean'] for a in assocsort], dtype=np.float)
>
>
> And have created the figure like the do in the example:
>
> p2 = figure(title='Mexican Literary Assoc. members\' co-occurrence', tools="save,resize,box_zoom,reset",
> x_range=assocsort, y_range=[0, max([maxim.max(), mean.max(), members.max()])],
> background_fill=None, plot_width=800, plot_height=400)
> p2.add_tools(HoverTool(tooltips=[("assoc.", " $x"),("result", " $y{int}")]))
>
>
>
> The problem is, I would like that the hover function would only show the bar-height values (see right.png) and not all the values along the y-axis (cf. wrong.png), but I am running out of ideas as for how to do it.
> Any help you could provide me will be highly appreciated it!!
>
> Have a great day!
>
> --
> You received this message because you are subscribed to the Google Groups "Bokeh Discussion - Public" group.
> To unsubscribe from this group and stop receiving emails from it, send an email to bokeh+un...@continuum.io.
> To post to this group, send email to bo...@continuum.io.
> To view this discussion on the web visit https://groups.google.com/a/continuum.io/d/msgid/bokeh/3eb346d3-33b0-46a6-9f04-d81aca2dc85f%40continuum.io\.
> For more options, visit https://groups.google.com/a/continuum.io/d/optout\.
> <right.png><wrong.png>
Just as reference for anyone who might see this post, if you had the same code as in this example you would need to add
p1.add_tools(HoverTool(tooltips=[(“country”, " @x"),(“# of medals”, " @height")]))
``
after drawing the p.rect
···
On Monday, October 5, 2015 at 9:46:54 PM UTC+2, Bryan Van de ven wrote:
Oh, you want the height of each bar as the value? You need to use that column name in your tooltip template, not “$y” which just prints the y coordinated of the cursor. E.g., if the column that controls the height of the quad is “foo”, then you want “@foo” to display the value of that column:
Thank you so much for your willingness to help me!
“17” is all right if what you want is the value of the current point ( that is of where the mouse is currently hovering) but what I need is the highest value of the barchart (what some call “data label”), which is stored in my ‘members’ np.array.
I just published my bar-chart so that you can take a look at it, and see what I mean
Have a nice day!
On Friday, September 25, 2015 at 5:24:44 PM UTC+2, Bryan Van de ven wrote:
Hi Silvia,
Do you mean the one with “result: 17” in the tooltip is wrong? I am assuming so, because I can’t actually think of why it should display that. Perhaps a bug? Is there any way you can share a minimal complete example that reproduces the problem? That would go a long way towards helping us debug things.
I am following this example to create my own bar chart.
I have pulled my data like this:
members = np.array([statdata[a][‘members’] for a in assocsort], dtype=np.float)
maxim = np.array([statdata[a][‘maxim’] for a in assocsort], dtype=np.float)
mean = np.array([statdata[a][‘mean’] for a in assocsort], dtype=np.float)
And have created the figure like the do in the example:
The problem is, I would like that the hover function would only show the bar-height values (see right.png) and not all the values along the y-axis (cf. wrong.png), but I am running out of ideas as for how to do it.
Any help you could provide me will be highly appreciated it!!