@verina09 I expect there is some way to make this happen. However, last time I tried, I was not able to make it work, so I am not sure it will be simple to accomplish. IIRC the issue was with the plot embed components getting double-escaped when trying to include them in a custom hover template. That said, last time I tried, the json_items API did not exist. That might actually make this more workable. If you do try to make a go of it, I would suggest trying to use that.
Thank you for your reply and suggestion, I looked into the API and apparently the sample code uses Flask (which I have no experience of). Nevertheless, I’ll update here again if I do try and manage to make it work. Thanks!
Just FYI, Flask is only there to highlight a common use-case example. It would not be needed or relevant at all to this experiment. The point about json_item: it lets you get a clean JSON representation of a Bokeh document (that you could e.g. try to put in a custom hover template).
@verina09 I am afraid I don’t know. When I take the code above and put it in a notebook, it works just exactly as well (which is to say, almost, but not quite, adequately). Did you make any changes to the code above?
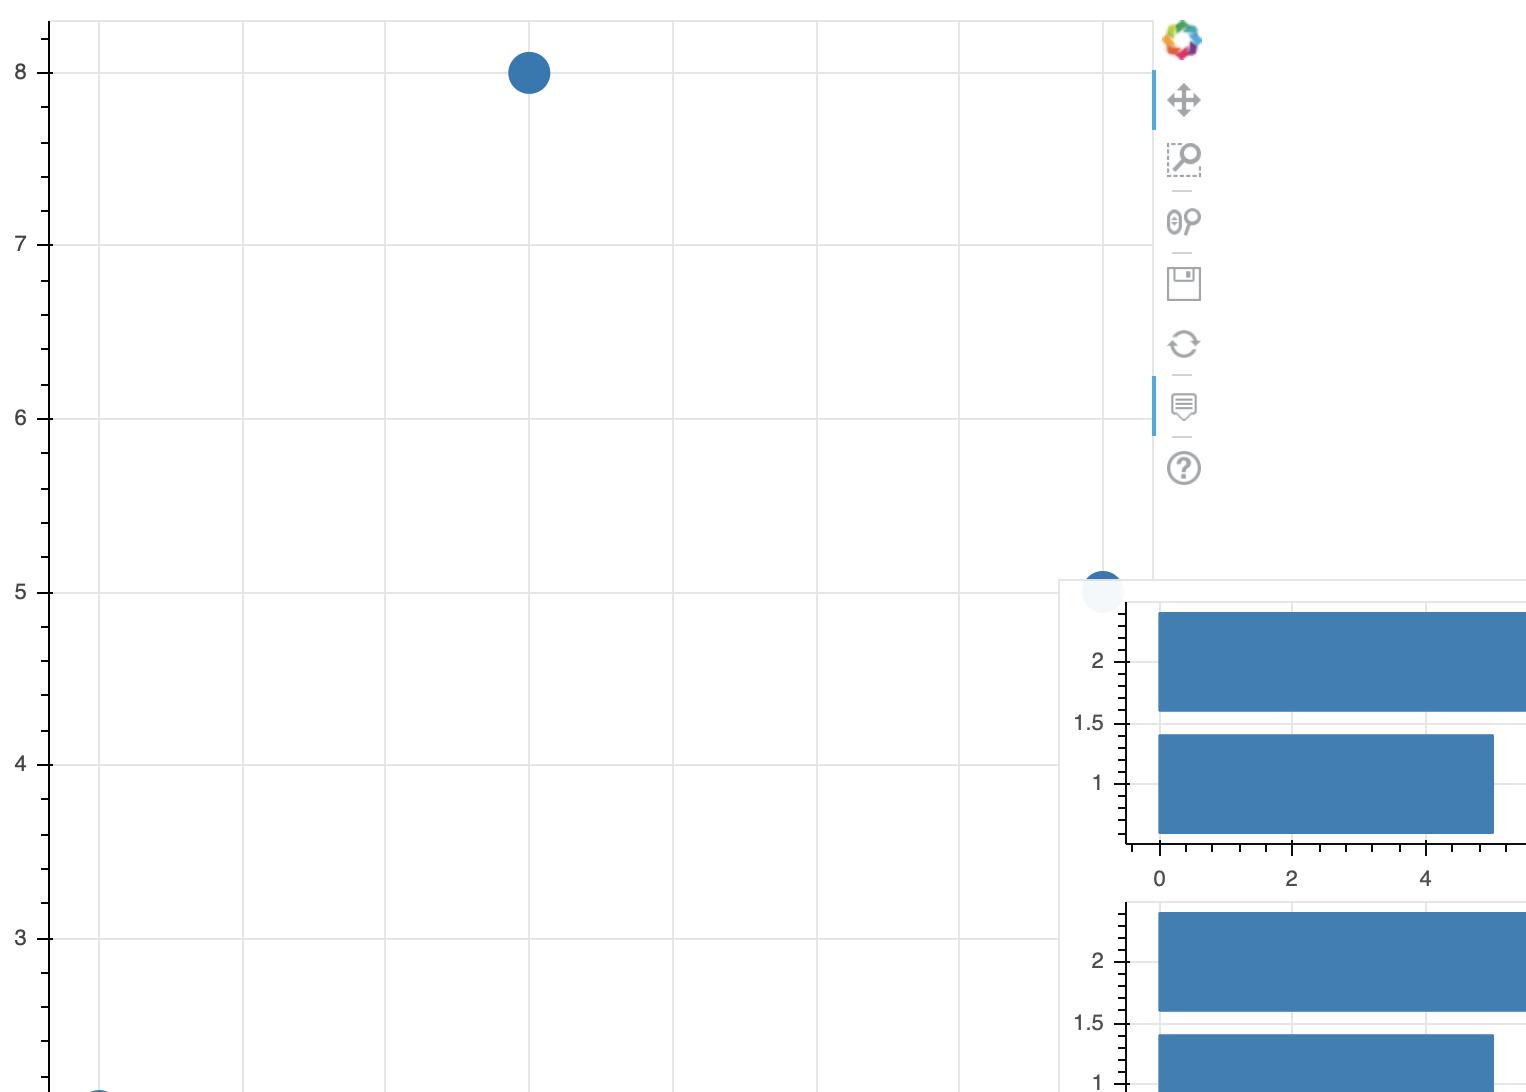
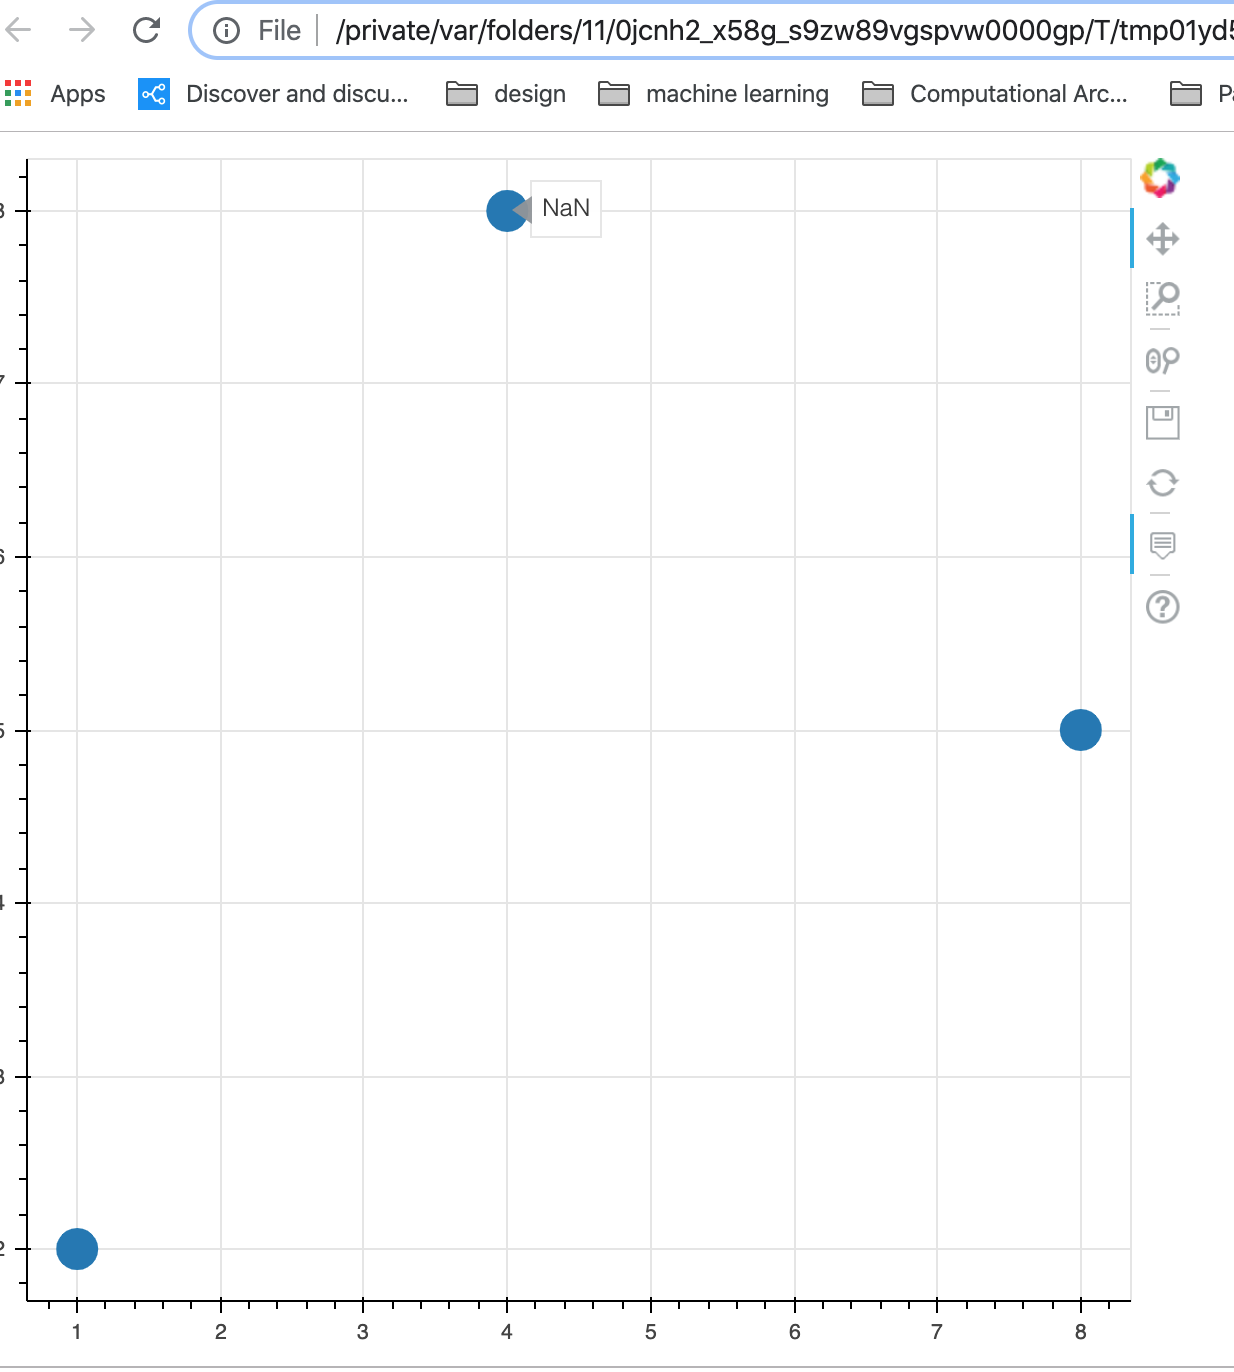
no I didn’t modify any code, a simple copy and paste gave me a NaN hover as per screenshot. Was reading the json_items() documentation, do I need to define my own plot function?
Sorry, I don’t understand the question. json_item takes any Bokeh object (e.g. plot or layout of some kind) and produces JSON. Then that JSON can be passed to a JS call to embed_items` to render it. I’m not sure what you mean by “plot function” here.
As for the NaN I unfortunately don’t know. I think we are at the point of having to compare detailed notebook, browser, etc. versions in case this is some very version-specific issue. That said, given my own experience, while this it is a promising start, I would not really consider what I have above as “ready to use”. I think at least some small amount of development work will be necessary to really make this use-case supported.