Playing around, this is tantalizingly close to a working POC
import json

from bokeh.embed import json_item
from bokeh.models import ColumnDataSource, CustomJSHover, HoverTool
from bokeh.plotting import figure, show

source = ColumnDataSource(data=dict(x=[1, 4, 8], y=[2, 8, 5]))

p = figure()
p.circle('x', 'y', size=20, source=source)


p2 = figure(plot_height=150, plot_width=400, toolbar_location=None)
p2.hbar(y=[1, 2], right=[5, 10], height=0.8)
out = json.dumps(json_item(p2, "tooltip-plot"))
source.data['plot'] = [out, out, out]

code="""
    Bokeh.embed.embed_item(JSON.parse(value))
    return ""
"""

p.add_tools(HoverTool(
    tooltips='<div id="tooltip-plot">@plot{custom}</div>',
    formatters={ '@plot': CustomJSHover(code=code) }
))

show(p)
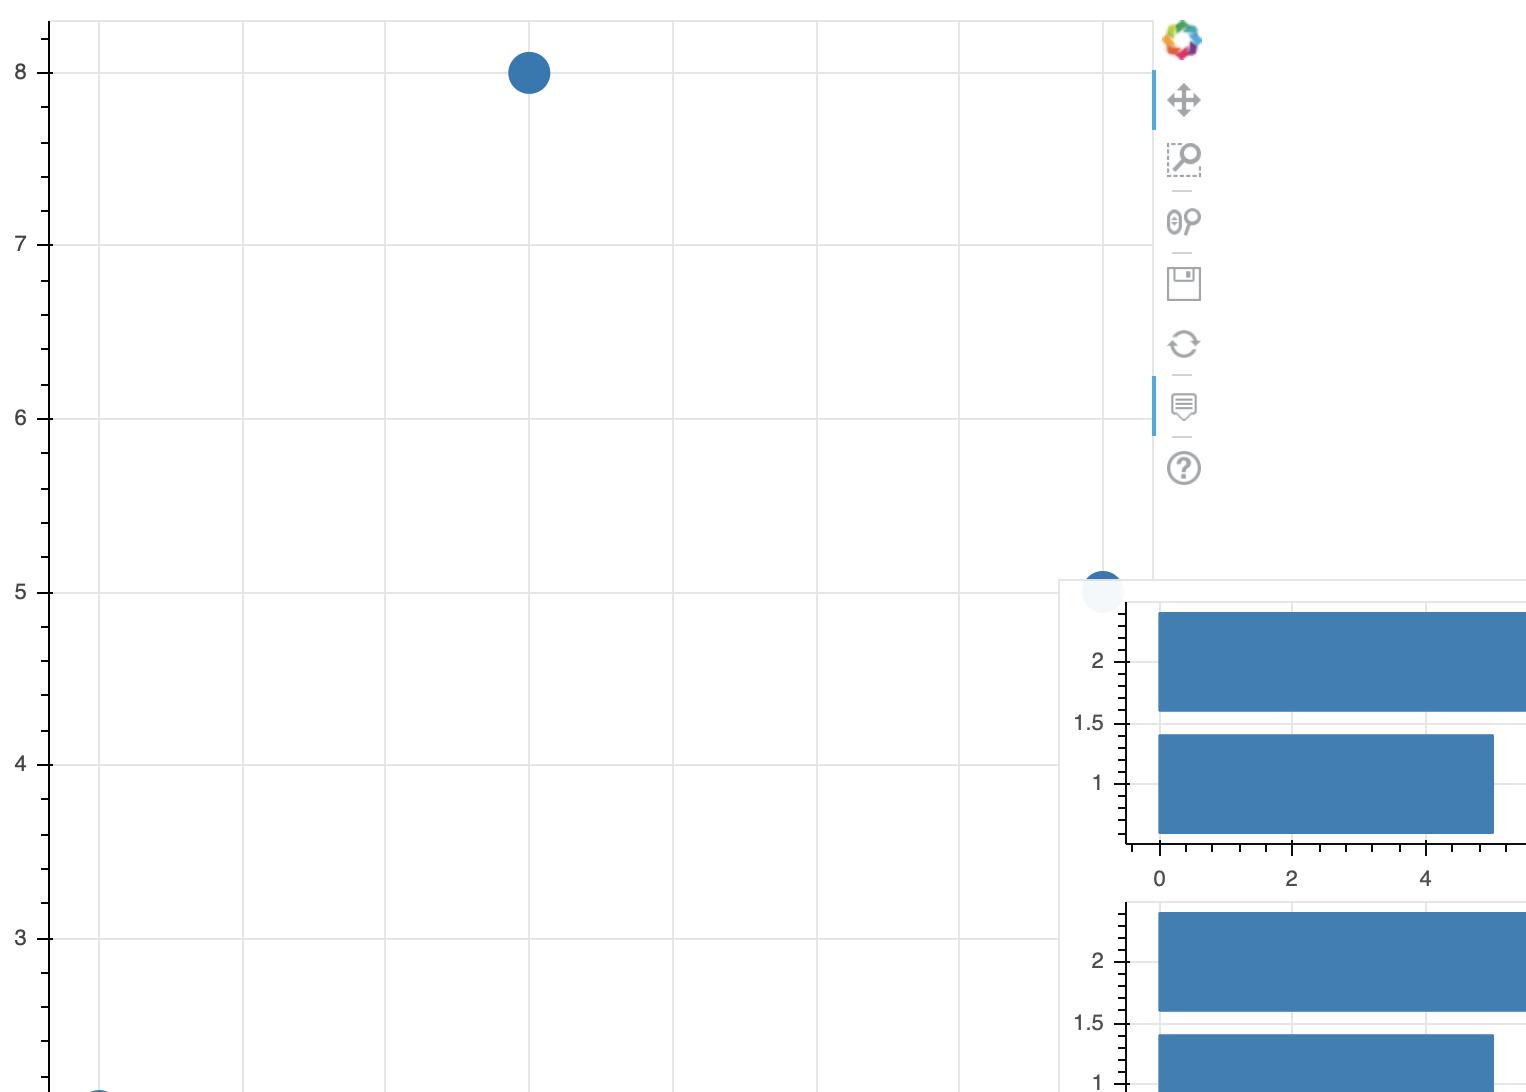
But sometimes it flickers extra subplots: