New to Bokeh and Python here. I’ve tried searching and am struggling to find the exact thing. I keep thinking it is a simple issue with index number/value but I can’t seem to solve it.
I’ve put a couple charts on a page and am wanting to add a Data Table widget as well. I can get the datatable on there and everything is ALMOST right.
I’m doing a year over year table, so I’m pivoting my data because in the end I want to see a row for each year, then 1 column for each month of the year.
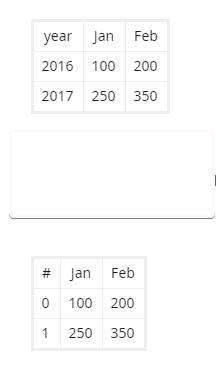
If I pivot this and look at the Pandas dataframe, everything looks great. (top example in picture)
If I put this in a datatable widget though, the months and actuals all line up great…but the year is gone and replaced with what I assume is just a row number/index as shown in the bottom example in picture.
What would be the way I’d go about displaying the year as well? I know there’s something simple here I’m missing…just can’t figure out how I need to reshape.
I guess removing index from DataTable should work.
Try this
data_table.index_position = None
Another method would be to reset index in data frame like df = df.reset_index() and use the index as a column instead. Let us know which works best for you.
Took some tweaking but a mixture of the reset_index idea and me stepping back and trying to manually do things I could see what was causing the hiccup.
It must be loop to define “columns” that was causing the issue, which makes sense if it was an index. If I manually identify the columns everything works and lines up like I’d expect.
Yes I think this exactly correct. Setting index_position = None hides the automatic table row index column that the table widget can show. When you do:
columns = [TableColumn(field=Ci, title=Ci) for Ci in df.columns]
You explicitly adding columns that will always be displayed. So if you happen to explicitly add a dataframe index in that loop, it will get displayed (index_position has nothing to say about that, this is just another user-provided column).