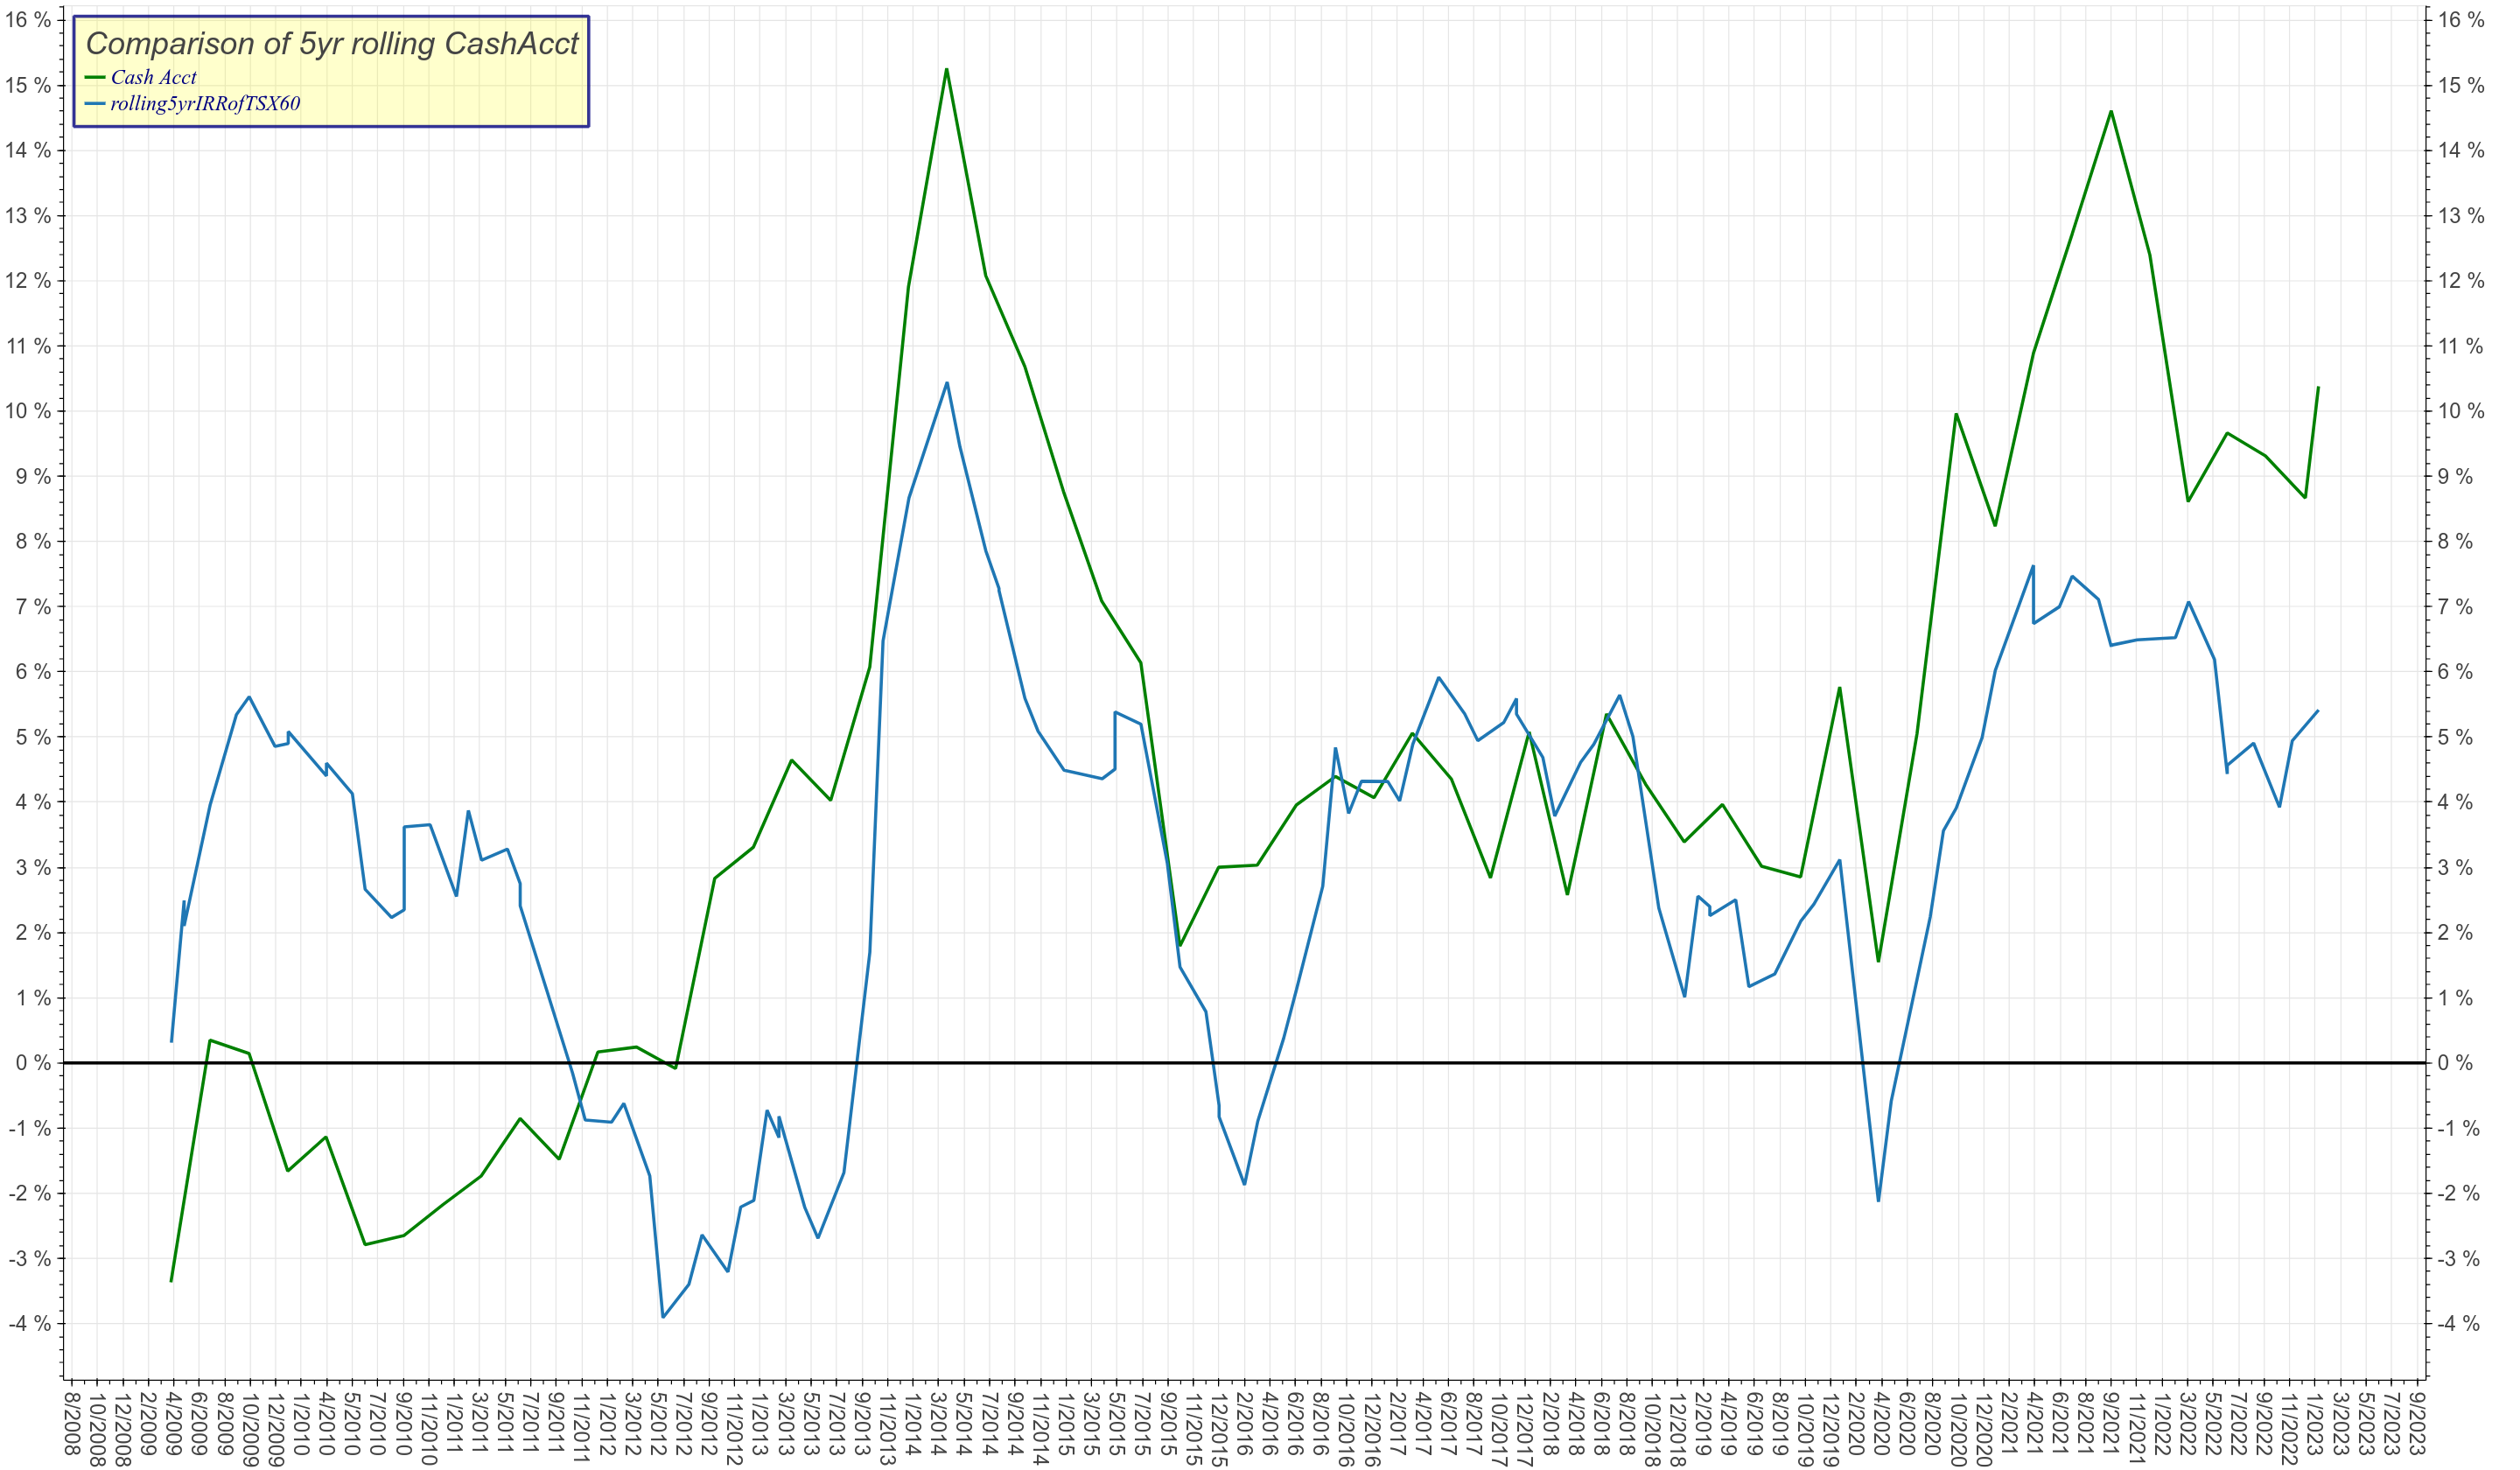
okay- wanted to use bokeh to make a graph comparing yahoofinance Toronto Stock Exchange data to my own portfolio.
Here is Attempt No. 1 using bokeh.plotting out of the box and DatetimeTickFormatter:
BLECHFooey! xaxis only shows a tick every 2 years- dat no good!
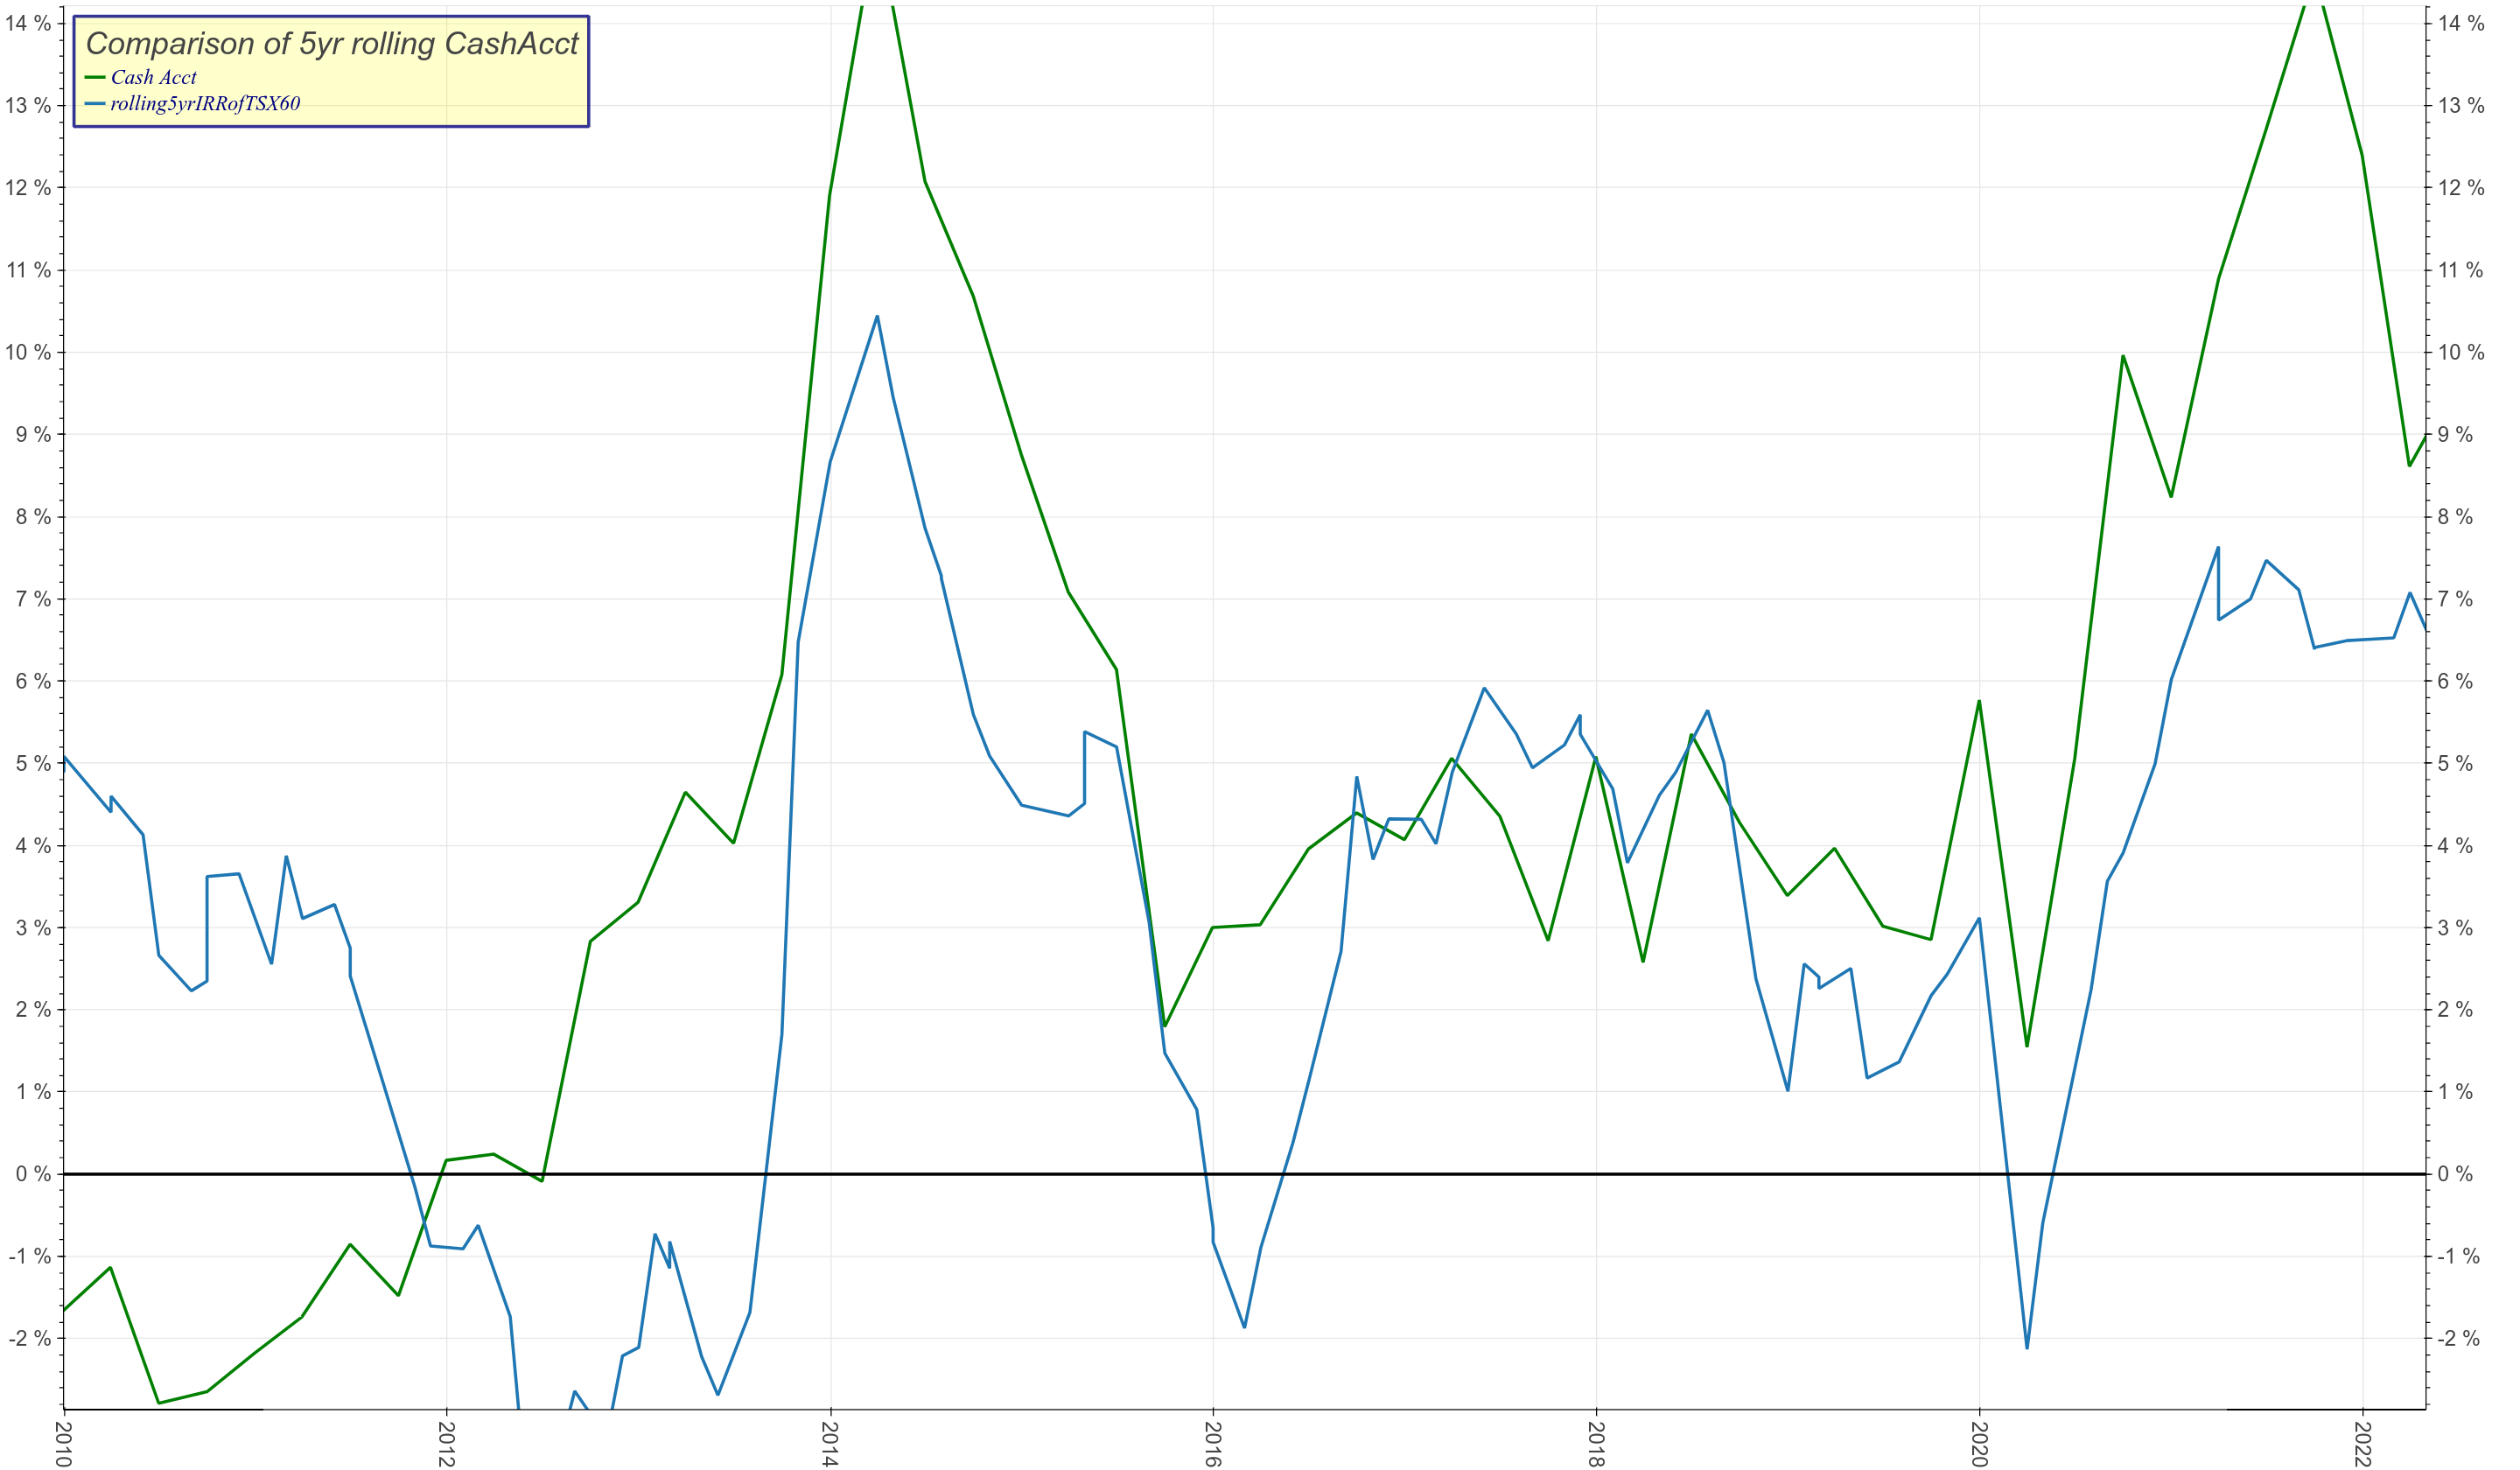
figured out that AdaptiveTicker speaks in 1/1000 sec intervals. So if I want an xtick every 2 months: 1000msec X 60 sec X 60 min X 24 Hours X 60 days = 5184000000
TICKERS = [AdaptiveTicker(max_interval = 5184000000,num_minor_ticks=2)]
p.xaxis.ticker.tickers = TICKERS
now look at these sweet xticks:
(ADMINS refuse to let me post the pic!!!- good job guys!)
I figured this out by reading other posts searching on AdaptiveTicker, which I would link to, but I am scared of try and find the link I will lose everything I typed, so I guess you will have to do that yourselves- Good Luck!