Hi guys,
Currently, I have a project(Flask + Bokeh Server + SQL server on Apache). Dataset, which is read from database at one time and saved in memory, is pretty big(3G - 5G).
If I load web app, speed is good. If I select item from “Select” on the left bar and update plot associated with big dataset, the speed is so slow. I launch threads to improve the performance a little bit.
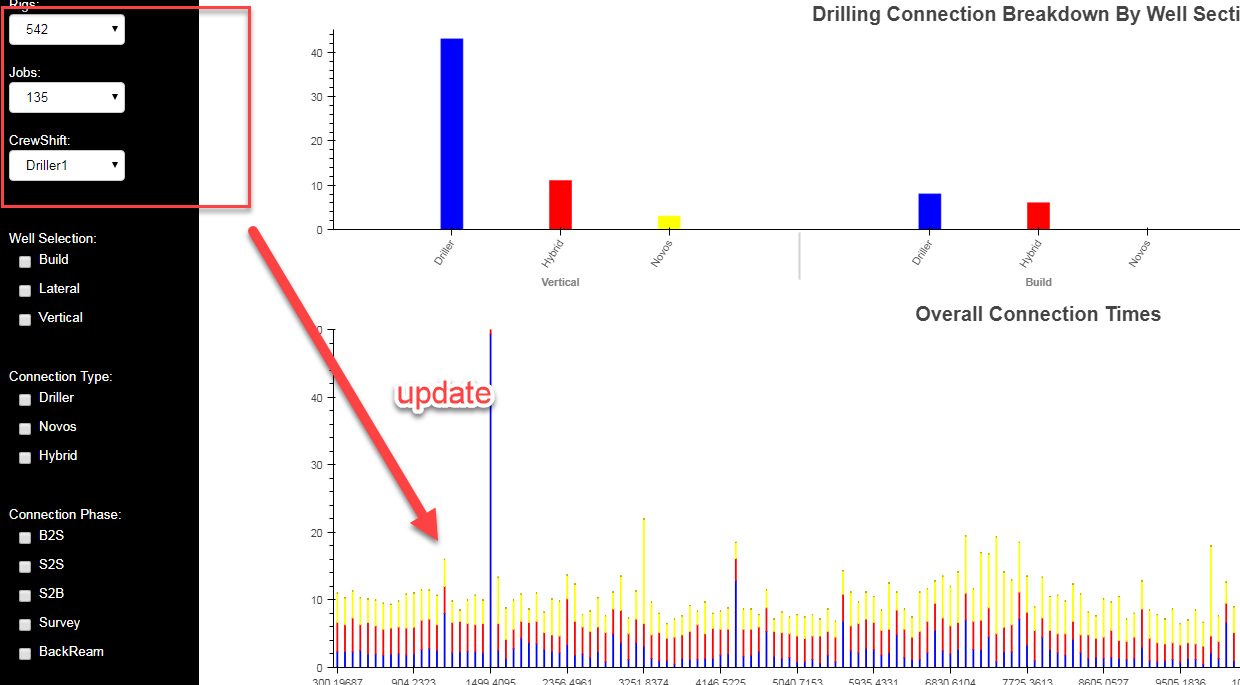
but the problem is still there. I get an idea on this issue. If the ColumnDataSource and corresponding plot can be dynamically removed, I like to remove the old ones, and recreate new one when a small dataset is read from database every time
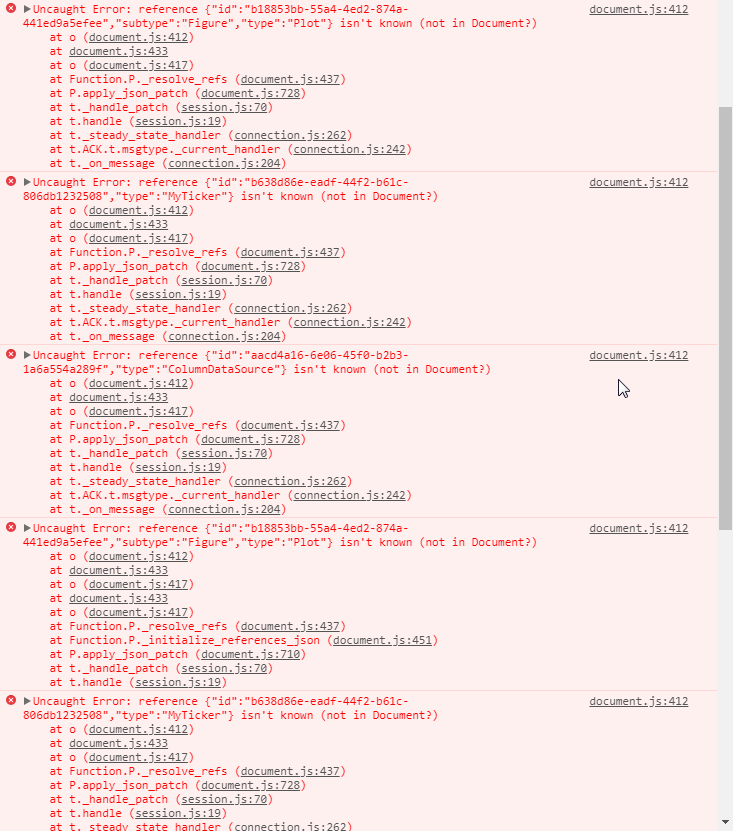
I did a lot research online, someone said that ColumnDataSource can not be removed dynamically. I also wonder if this issue is from Bokeh itself. that is, if dataset is big enough, the performance is automatically down.
I stuck on this issue in this entire week and can not do anything. welcome any ideas or clues.
the code is post below.
thanks
def rigs_combx_change(attrname, old, new):
rig, job = new, jobs_combx.value
selected_rig = rig
selected_job = job
    from_comboBx_group = False
    update_main_plot(selected_rig, selected_job, from_comboBx_group)
def jobs_combx_change(attrname, old, new):
rig, job = rigs_combx.value, new
selected_rig = rig
selected_job = job
from_comboBx_group = False
update_main_plot(selected_rig, selected_job, from_comboBx_group)
update_main_plot_queue = queue.Queue()
update_main_plot_event = threading.Event()
update_main_plot_thread = Thread(name=‘update_main_plot_thread’, \
target = lambda q, arg1, arg2, arg3, arg4, arg5, arg6, arg7, arg8, arg9, arg10, arg11, arg12: q.put(all_main_plot.update_main_plot_chart(arg1, arg2, arg3, arg4, arg5, arg6, arg7, arg8, arg9, arg10, arg11, arg12)), \
args = (update_main_plot_queue, \
doc, \
update_main_plot_event, \
mainplot_source, \
main_plot, \
mainplot_data_all, \
checkbox_group_1_selections, \
checkbox_group_2_selections,\
checkbox_group_3_selections, \
all_connection_dict,\
rig, \
job, \
from_comboBx_group))
update_main_plot_thread.start()
update_main_plot_event.set()
@gen.coroutine
def update_main_plot(selected_rig, \
selected_job, \
from_comboBx_group, \
checkbox_group_1_selections = ,\
checkbox_group_2_selections = , \
checkbox_group_3_selections = ):
    doc = curdoc()
    update_main_plot_queue.put(all_main_plot.update_main_plot_chart(doc, \
                                         update_main_plot_event, \
                                         mainplot_source, \
                                         main_plot, \
                                         mainplot_data_all, \
                                         checkbox_group_1_selections, \
                                         checkbox_group_2_selections,\
                                         checkbox_group_3_selections, \
                                         all_connection_dict,\
                                         selected_rig, \
                                         selected_job, \
                                         from_comboBx_group))
    update_main_plot_event.set()
@without_document_lock
def update_main_plot_chart( doc, \
update_main_plot_event, \
mainplot_source, \
main_plot, \
mainplot_data_all, \
checkbox_group_1_selections, \
checkbox_group_2_selections,\
checkbox_group_3_selections, \
all_connection_dict,\
rig, \
job, \
from_comboBx_group):
update_main_plot_event.wait()
main_plot_dict = {}
depth_list =
if from_comboBx_group == True:
main_plot_dict = update_checkBx_groups_dict(all_connection_dict, \
rig, job, \
checkbox_group_1_selections, \
checkbox_group_2_selections)
main_plot_dict, depth_list = update_main_plot_dict(main_plot_dict, checkbox_group_3_selections)
else:
main_plot_dict = update_checkBx_groups_dict(all_connection_dict, \
rig, job)
main_plot_dict, depth_list = update_main_plot_dict(main_plot_dict)
depth_list = [str(x) for x in depth_list]
doc.add_next_tick_callback(partial(update_main_plot_source, main_plot = main_plot, main_plot_dict = main_plot_dict, depth_list = depth_list, mainplot_data_all = mainplot_data_all, mainplot_source = mainplot_source))
def updateSourceData(in_mainplot_data_type, in_mainplot_data, in_all_data):
new_list =
in_mainplot_data_length = len(in_mainplot_data[in_mainplot_data_type])
i = 0
for item in in_all_data[‘HoleDepth’]:
if item != ‘-1’:
if i >= in_mainplot_data_length:
if in_mainplot_data_type == ‘VBarColors’:
new_list.append(‘white’)
else:
new_list.append(’’)
else:
var = in_mainplot_data[in_mainplot_data_type][i]
new_list.append(var)
i = i + 1
else:
if in_mainplot_data_type == ‘VBarColors’:
new_list.append(‘white’)
else:
new_list.append(’’)
return new_list
@gen.coroutine
def update_main_plot_source(main_plot, main_plot_dict, depth_list, mainplot_data_all, mainplot_source):
mainplot_source.data[‘HoleDepth’] = update_holeDepth_list(main_plot_dict, mainplot_data_all, depth_list)
mainplot_source.data[‘VBarTop’] = updateSourceData(‘VBarTop’, main_plot_dict, mainplot_source.data)
mainplot_source.data[‘VBarBottom’] = updateSourceData(‘VBarBottom’, main_plot_dict, mainplot_source.data)
mainplot_source.data[‘VBarColors’] = updateSourceData(‘VBarColors’, main_plot_dict, mainplot_source.data)
vBarType_list = updateSourceData(‘VBarType’, main_plot_dict, mainplot_source.data)
mainplot_source.data[‘VBarType’] = vBarType_list
main_plot.x_range.factors =
main_plot.x_range.factors = depth_list
``