Hello, I didn’t want to post this on the bugs page yet in case I am doing something incorrect.
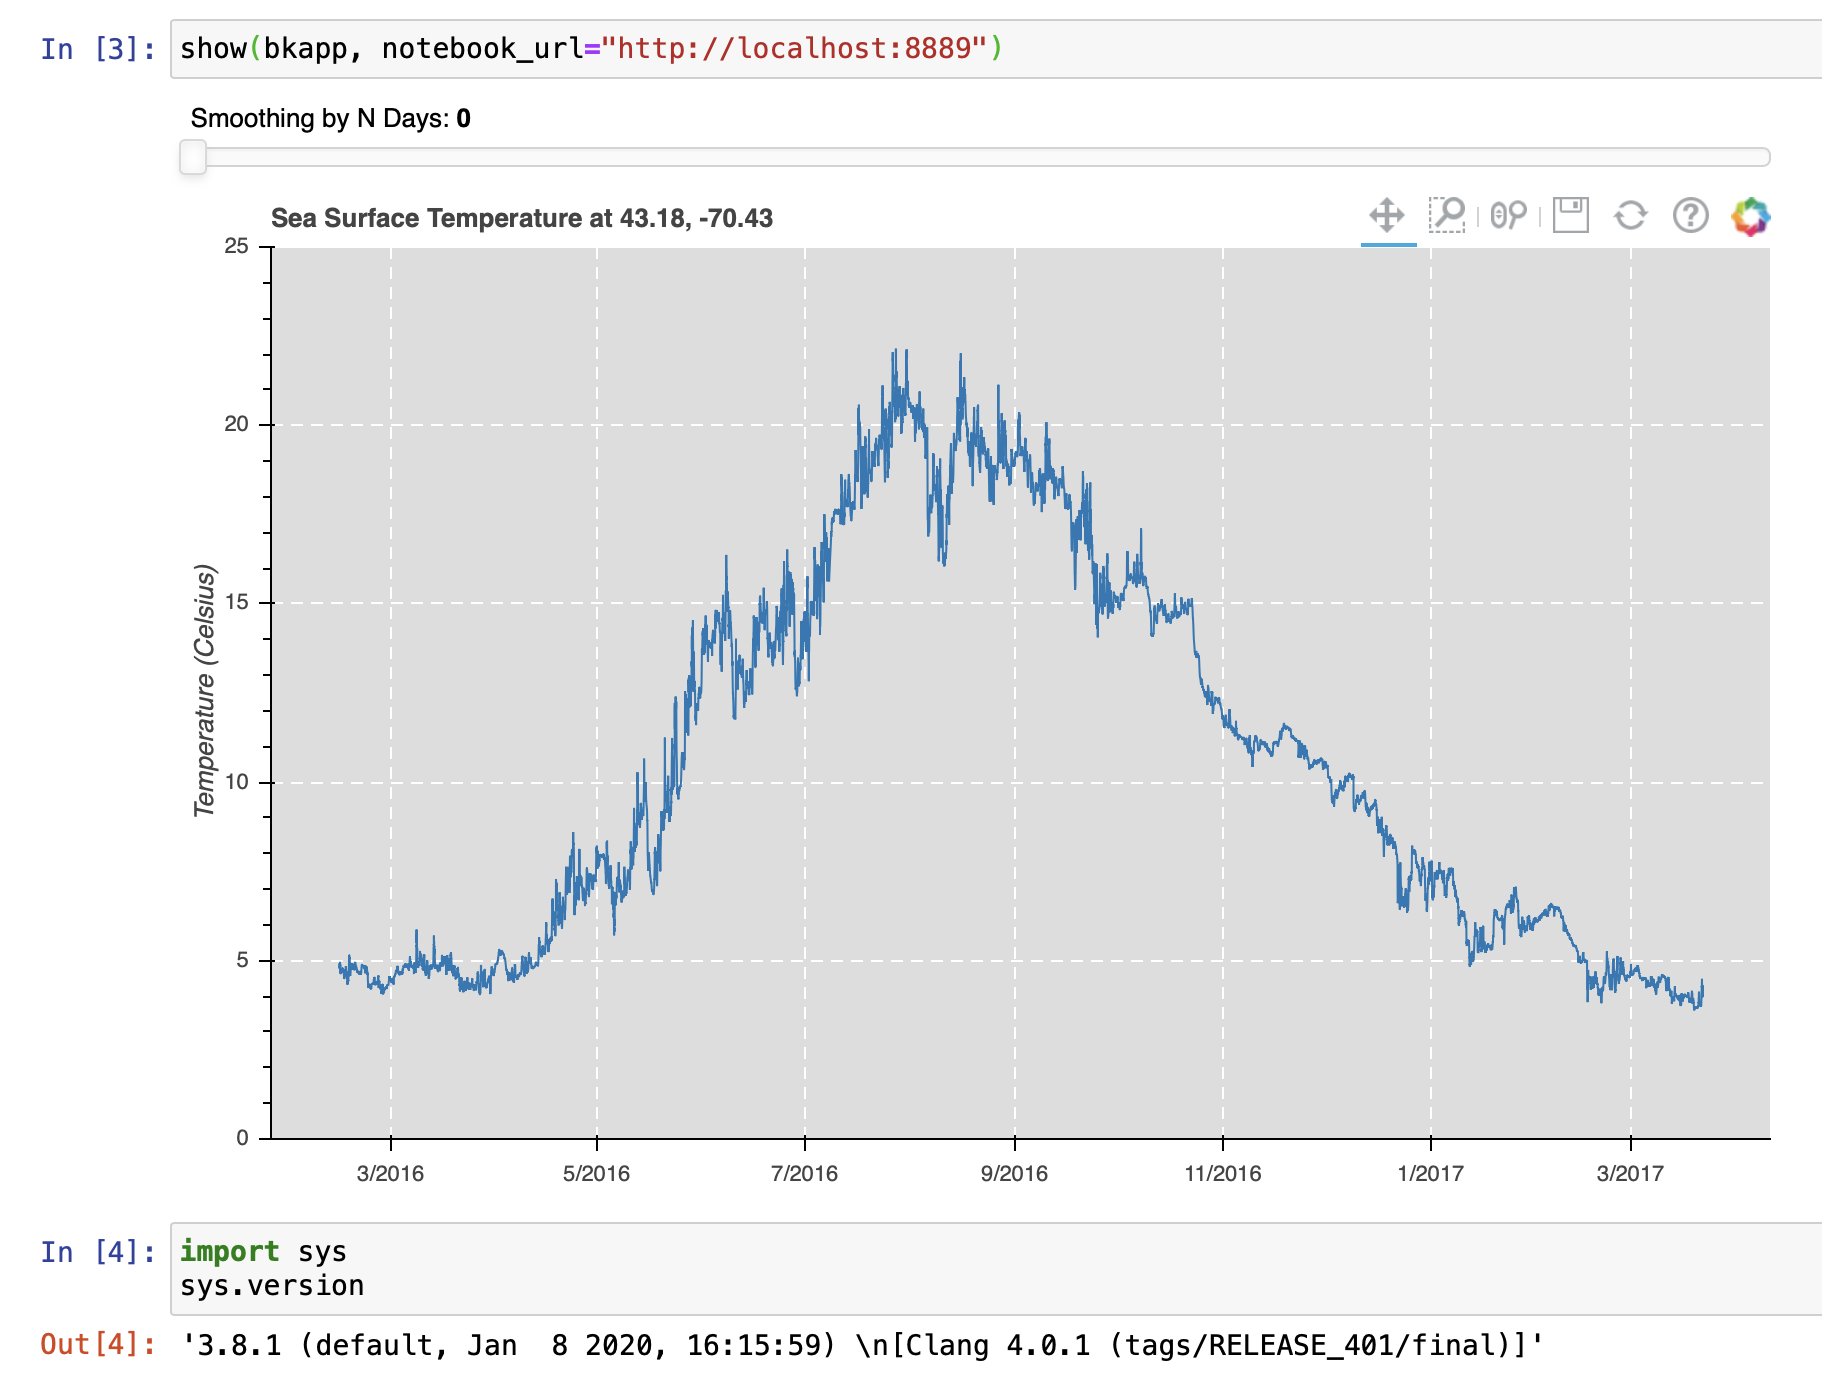
The following code * works perfectly in a Jup notebook in a fresh python 3.7.3 venv, but the app does not display using identical code and python 3.8.3. Am I doing something wrong or should I open an issue?
This is just a regular venv with notebook and bokeh installed using pip (not conda or something else).
from bokeh.io import output_notebook, show
from bokeh.plotting import figure
from bokeh.models import ColumnDataSource, HoverTool
import pandas as pd
import numpy as np
from bokeh.layouts import grid
from bokeh.models import Button, TextInput


output_notebook()

sample1 = np.random.multivariate_normal([0,0], [[1,0],[0,1]], 100)
sample2 = np.random.multivariate_normal([1,1], [[0.05,0],[0,0.05]], 100)
sample = np.concatenate([sample1, sample2])

df = pd.DataFrame(sample, columns=('x','y'))
df['value'] = np.sqrt(df['x']**2 + df['y']**2)
df.head()

source = ColumnDataSource(df)
tools = "box_zoom, undo, crosshair"

def modify_doc(doc):
    # same as before
    source = ColumnDataSource(df)
    p = figure(tools=tools)
    p.scatter('x','y', source=source, alpha=0.5)
    p.add_tools(
        HoverTool(
            tooltips=[('value','@value{2.2f}'),
                      ('index', '@index')]
        )
    )

    # this function is called when the button is clicked
    def update():
        # number of points to be added, taken from input text box
        n = int(npoints.value)
        # new sample of points to be added.
        # we use the a narrow gaussian centred on (-1, 1),
        # and draw the requested number of points
        sample3 = np.random.multivariate_normal([-1,-1], [[0.05,0],[0,0.05]], n)
        df_new = pd.DataFrame(sample3, columns=('x','y'))
        df_new['value'] = np.sqrt(df['x']**2 + df['y']**2)
        # only the new data is streamed to the bokeh server,
        # which is an efficient way to proceed
        source.stream(df_new)

    # GUI:
    button = Button(label='add points:')
    npoints = TextInput(value="50")
    button.on_click(update)
    # arranging the GUI and the plot.
    layout = grid([[button, npoints], p])
    doc.add_root(layout)

show(modify_doc)
* Codes comes from this tutorial: Interactive Visualization with Bokeh