I’m trying to use bokeh.charts.HeatMap
on 38k rows of data. That doesn’t sound like too big a task to
me, but it takes several minutes for this to complete. Is there
a better way to do the following 3 steps (broken up to show
timings):
from pandas import options, read_csv
from bokeh.charts import HeatMap, bins
fuel = read_csv('../data/fueleconomy/vehicles.csv')
fuel.dropna(subset='highway08 displ'.split(), inplace=True, how='any')
This takes 445ms and
vehicles.csv
can be found at https://www.fueleconomy.gov/feg/download.shtml
in Zipped CSV File. Followed by the HeatMap
creation step (which takes all the time):
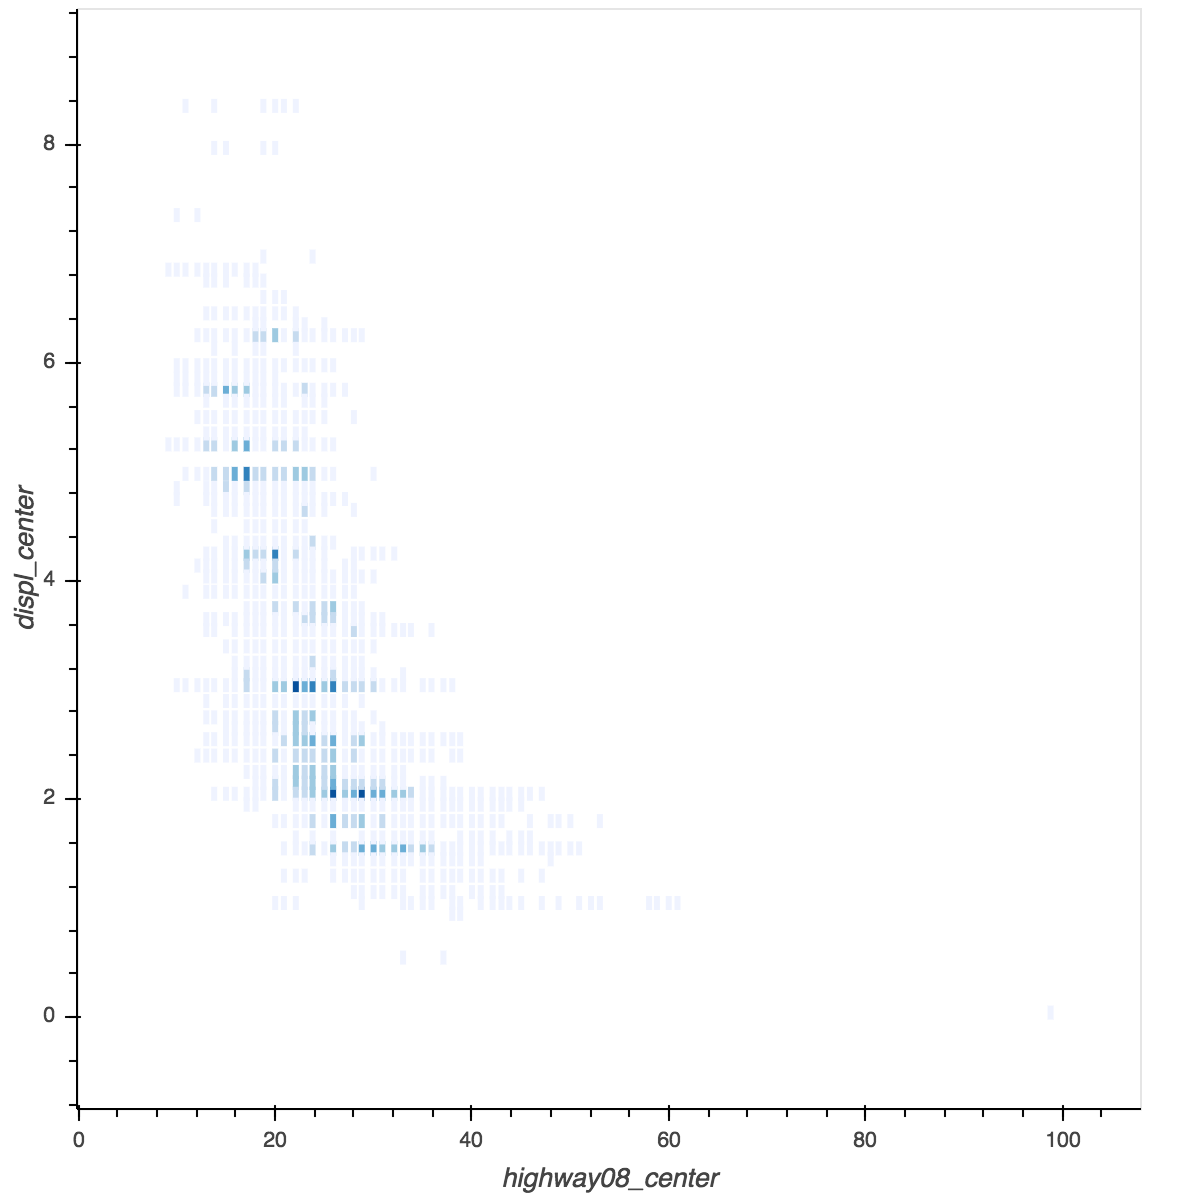
fuel_hp = HeatMap(fuel, x=bins('highway08'), y=bins('displ'), legend=None)
This requires 4
minutes and 24 seconds, after which the plot is displayed with show(fuel_hp)
in 82ms:
My sense was that
the actual time to compute a heatmap isn’t that great, so I
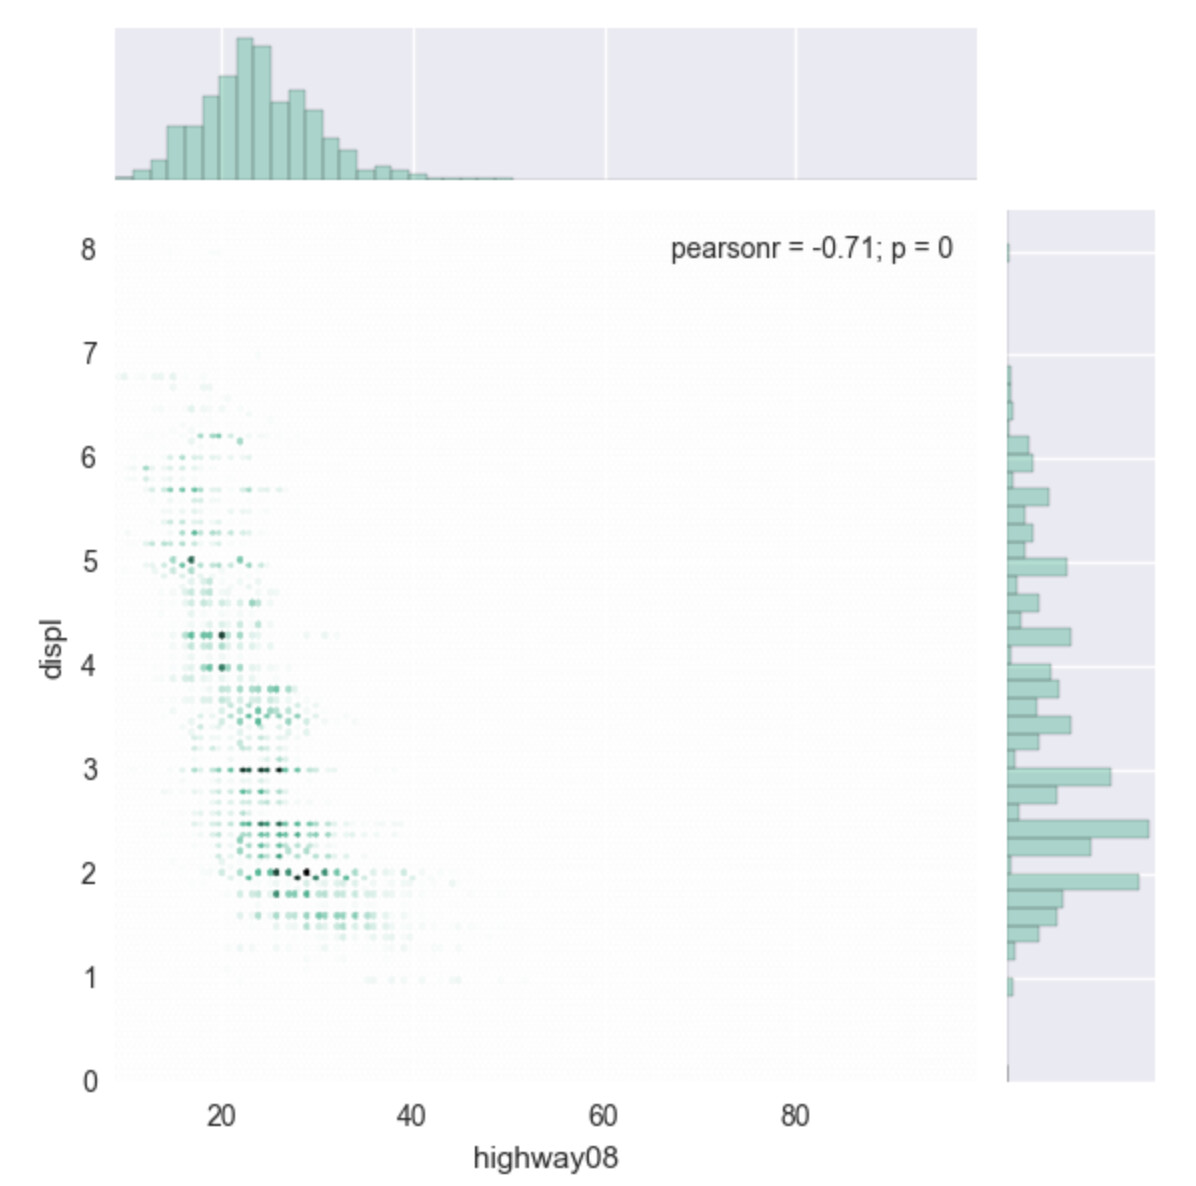
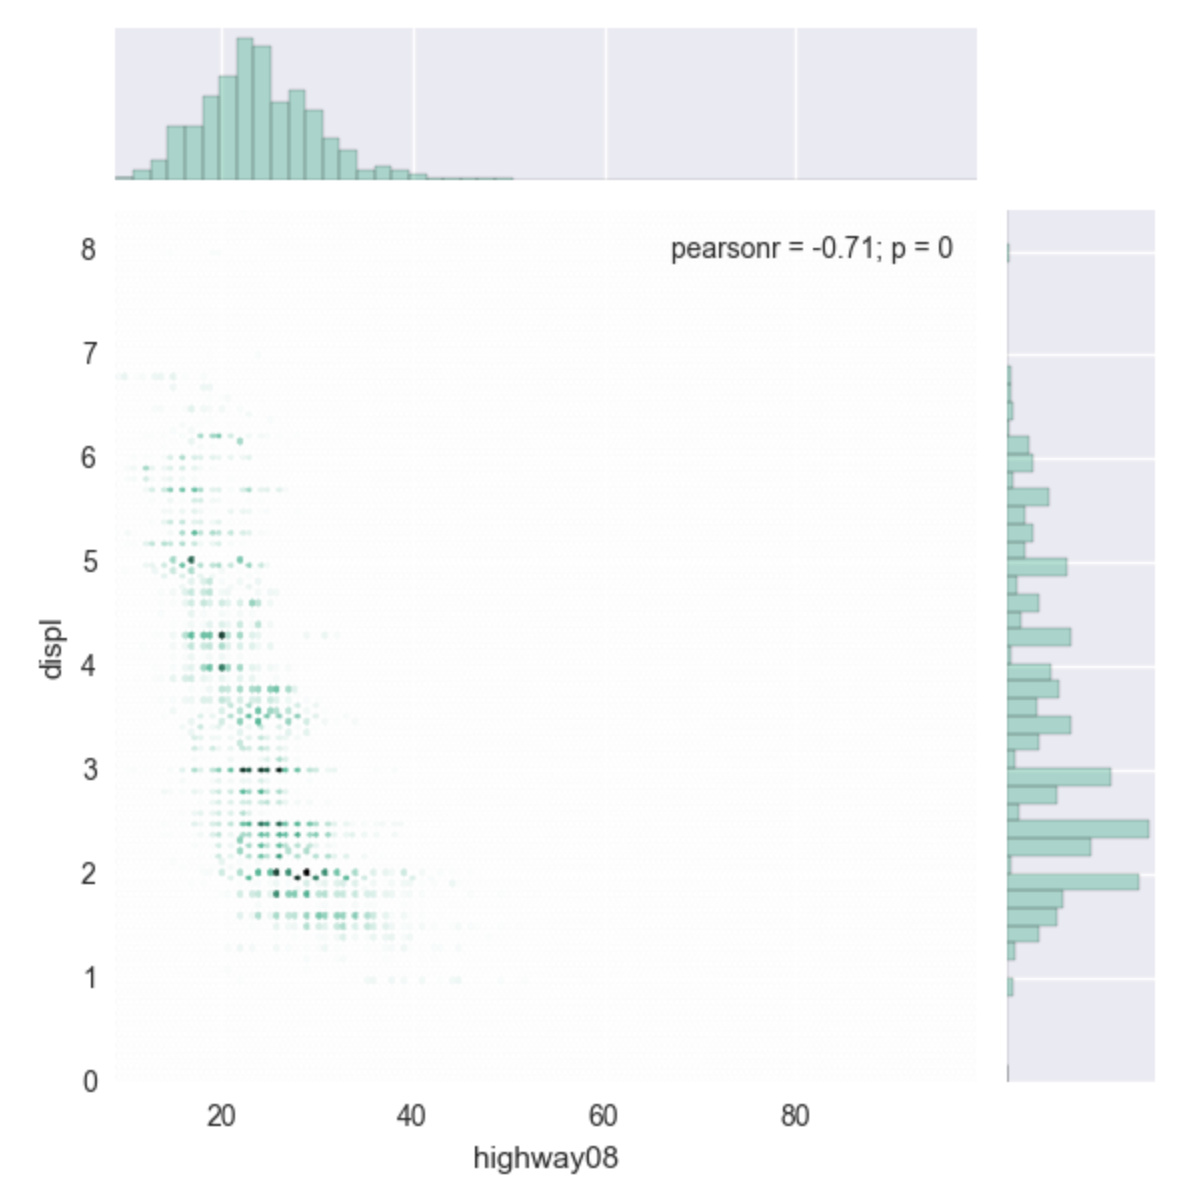
tried using seaborn.jointplot
to generate a static (matplotlib) hexbin map from exactly the
same data:
import seaborn as sns
sns.jointplot(fuel.highway08, fuel.displ, kind="hex", color="#4CB391")
This required only
672 ms to create a static version of effectively the same
information:
Are there any ways
to adjust the Bokeh code to run in, at most, 20 seconds? Fewer
bins? As a last resort I can decimate the data by striding to
sample it, e.g.
fuel_hp = HeatMap(fuel[::20], x=bins('highway08'), y=bins('displ'), legend=None)
which takes 15
seconds, but if I can avoid that it would be great.
TIA. Ian