I’m developing the Flask application using the Bootstrap portal. One of the pages has three HTML tabs and a dropdown. Each tab has one Bokeh component (model). Tab “Info” includes bokeh embedded histogram bar plot, Tab “Data” — bokeh DataTable, and Tab “Details” — bokeh scatter plot.
The histogram plot and DataTable are embedded components. The scatter plot is a bokeh server application that renders in an HTML template using the server_document() method.
I also have the fourth element — a bokeh Select. The users select the option from the Select dropdown and the app using a select.js_on_change('value', callback) calls the callback function. The callback CustomJS code updates the three ColumnDataSource(s) for histogram, table, and scatter plot.
I created a bokeh server app with a histogram and Select with both Python and JavaScript callbacks. Everything works fine in both cases.
On the HTML page, the histogram and Select have their places. This is why I have to embed them as components and use CustomJS for callback updates. But when I put them as separate components inside my Flask portal, I got the “Models must be owned by only a single document, UnionRenderers(id=‘p1006’, …) is already in a doc”. I looked at the bokeh documentation, searched for this type of error, and tried to implement some ideas that I found but without success.
Here is the code only for histogram and Select:
import pickle
from os.path import join, dirname
import numpy as np
import pandas as pd
from benedict import benedict
from bokeh.layouts import row
from bokeh.models import (HoverTool, Select, CustomJS)
from bokeh.plotting import figure, ColumnDataSource, curdoc
@blueprint.route('/dashbokeh/test')
@login_required
def test():
with open(f"{bokehdata}/clusters/info/bd_info_domains.pkl", 'rb') as f:
bd_info_domains: benedict = pickle.load(f)
df_tso = pd.read_pickle(f"{bokehdata}/clusters/info/df_info_tnum_sim_torg_nodupl.pkl")
dicttso = df_tso[['torgname', 'similarity']].to_json(orient='records')
menu = list(bd_info_domains['dropdown'].values())
# define select
domselect = Select(name="seldom", title="Option:", value="", options=menu)
# create a histogram for the intit value
histdata = df_tso.loc[df_tso['torgname'] == menu[0]]['similarity'].tolist()
hist, edges = np.histogram(histdata, bins=5)
# create a ColumnDataSource object
histsource = ColumnDataSource(data=dict(hist=hist, left=edges[:-1], right=edges[1:]))
# create a quad plot
phist = figure(name="histplot", height=650, width=650, title="Quad plot")
# call the quad method on our figure object p
phist.quad(bottom=0, top='hist', left='left', right='right', source=histsource, line_color="white")
callback = CustomJS(args=dict(source=histsource, dicttso=dicttso, hbins=5),
code=open(join(dirname(__file__), "histupdate.js")).read())
# attach the callback function to the select widget
domselect.js_on_change('value', callback)
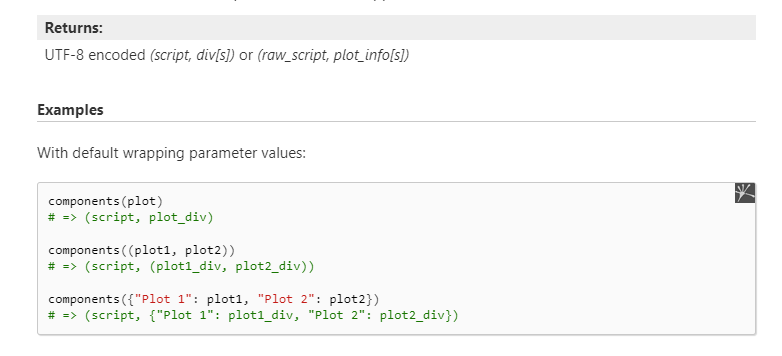
# creating components
select_script, select_div = components(domselect)
hist_script, hist_div = components(phist)
parms = {
'select_script': select_script,
'select_div': select_div,
'hist_script': hist_script,
'hist_div': hist_div
}
return render_template(template_name_or_list='dashbokeh/test.html', **parms)
Here is the CustonJS code (“histupdate.js”). The JavaScript code searches for the code in the lookup array by the Select selected value (a description), then selects the series for the found code and sends it for histogram calculations. After that, CustomJS updates the source.data with new histogram data.
// Path: histupdate.js
function histogram(data, bins) {
    const min = Math.min(...data);
    const max = Math.max(...data);
    const binWidth = (max - min) / bins;
    const result = new Array(bins).fill(0);
    const edges = new Array(bins + 1).fill(0);
    for (let i = 0; i < bins + 1; i++) {
        edges[i] = min + i * binWidth;
    }
    for (let i = 0; i < data.length; i++) {
        const binIndex = Math.floor((data[i] - min) / binWidth);
        if (binIndex >= 0 && binIndex < bins) {
            result[binIndex]++;
        }
    }
    return {histogram: result, edges: edges};
}
function search(nameKey, myArray){
    var newArray = [];
    for (let i=0; i < myArray.length; i++) {
        if (myArray[i].torgname === nameKey) {
            newArray.push(myArray[i].similarity);
        }
    }
    return newArray;
}

console.log('histupdate.js: loaded')

var data = source.data;
var selval = cb_obj.value;
var dftso = JSON.parse(dicttso);

var sc = search(selval, dftso);
var hbins = hbins;

var new_hist = histogram(sc, hbins).histogram;
var new_edges = histogram(sc, hbins).edges;

data['hist'] = new_hist;
data['left'] = new_edges.slice(0, -1);
data['right'] = new_edges.slice(1);

source.change.emit();
And finally, the HTML:
{% extends "layouts/base.html" %}

{% block title %} Test Info Domain {% endblock %}

<!-- Specific Page CSS goes HERE  -->
{% block stylesheets %}
{% endblock stylesheets %}

{% block content %}
    <div class="col-12 mb-4">
        <div class="container-fluid text-center">
            <h4>Test Overview</h4>
        </div>
    </div>
    <div class="row">
        <div class="col-12 col-xl-8">
            {{ select_div|safe }}
            {{ select_script|safe }}
        </div>
    <div class="col-12 col-xl-8">
            {{ hist_div|safe }}
            {{ hist_script|safe }}
        </div>
    </div>

{% endblock content %}

<!-- Specific Page JS goes HERE  -->
{% block javascripts %}
    <script type="text/javascript"  src="https://cdn.bokeh.org/bokeh/release/bokeh-3.0.3.min.js" crossorigin="anonymous"></script>
    <script type="text/javascript"  src="https://cdn.bokeh.org/bokeh/release/bokeh-widgets-3.0.3.min.js" crossorigin="anonymous"></script>
    <script type="text/javascript"  src="https://cdn.bokeh.org/bokeh/release/bokeh-tables-3.0.3.min.js" crossorigin="anonymous"></script>
    <script type="text/javascript"  src="https://cdn.bokeh.org/bokeh/release/bokeh-gl-3.0.3.min.js" crossorigin="anonymous"></script>
    <script type="text/javascript"  src="https://cdn.bokeh.org/bokeh/release/bokeh-mathjax-3.0.3.min.js" crossorigin="anonymous"></script>
    <script type="text/javascript" src="https://cdn.bokeh.org/bokeh/release/bokeh-api-3.0.3.min.js" crossorigin="anonymous"></script>
{% endblock javascripts %}
I would appreciate some advice or ideas on how to solve this problem.
P.S. If I add both models to the document root using curdoc().add_root(), I can open the page without error. But the callback emit doesn’t update the histogram even though I can see JavaScript processing in the console.