On Mar 21, 2016, at 8:29 AM, Partapsing, Rakesh <[email protected]> wrote:
Hi Bryan,
It is an honor hearing from you as I have worked through some of your inspiring classes on youtube. Thank you so much for explaining. Actually this is exactly the discussion I had earlier on Friday with my own boss (who also told me to restrict my search to the official docs). As data scientists within Océ we really support Bokeh and are looking forward to what else will be built.
Although at some point we have to freeze the version and start working with that, especially if the API's are subjected to such dramatic changes. We need to create a visualization dashboard/module (low level) which all of function designers will work with (high level).
I am not quite sure what you mean by 'using the mailing list', but I do have an issue I have been struggling with the past few days.
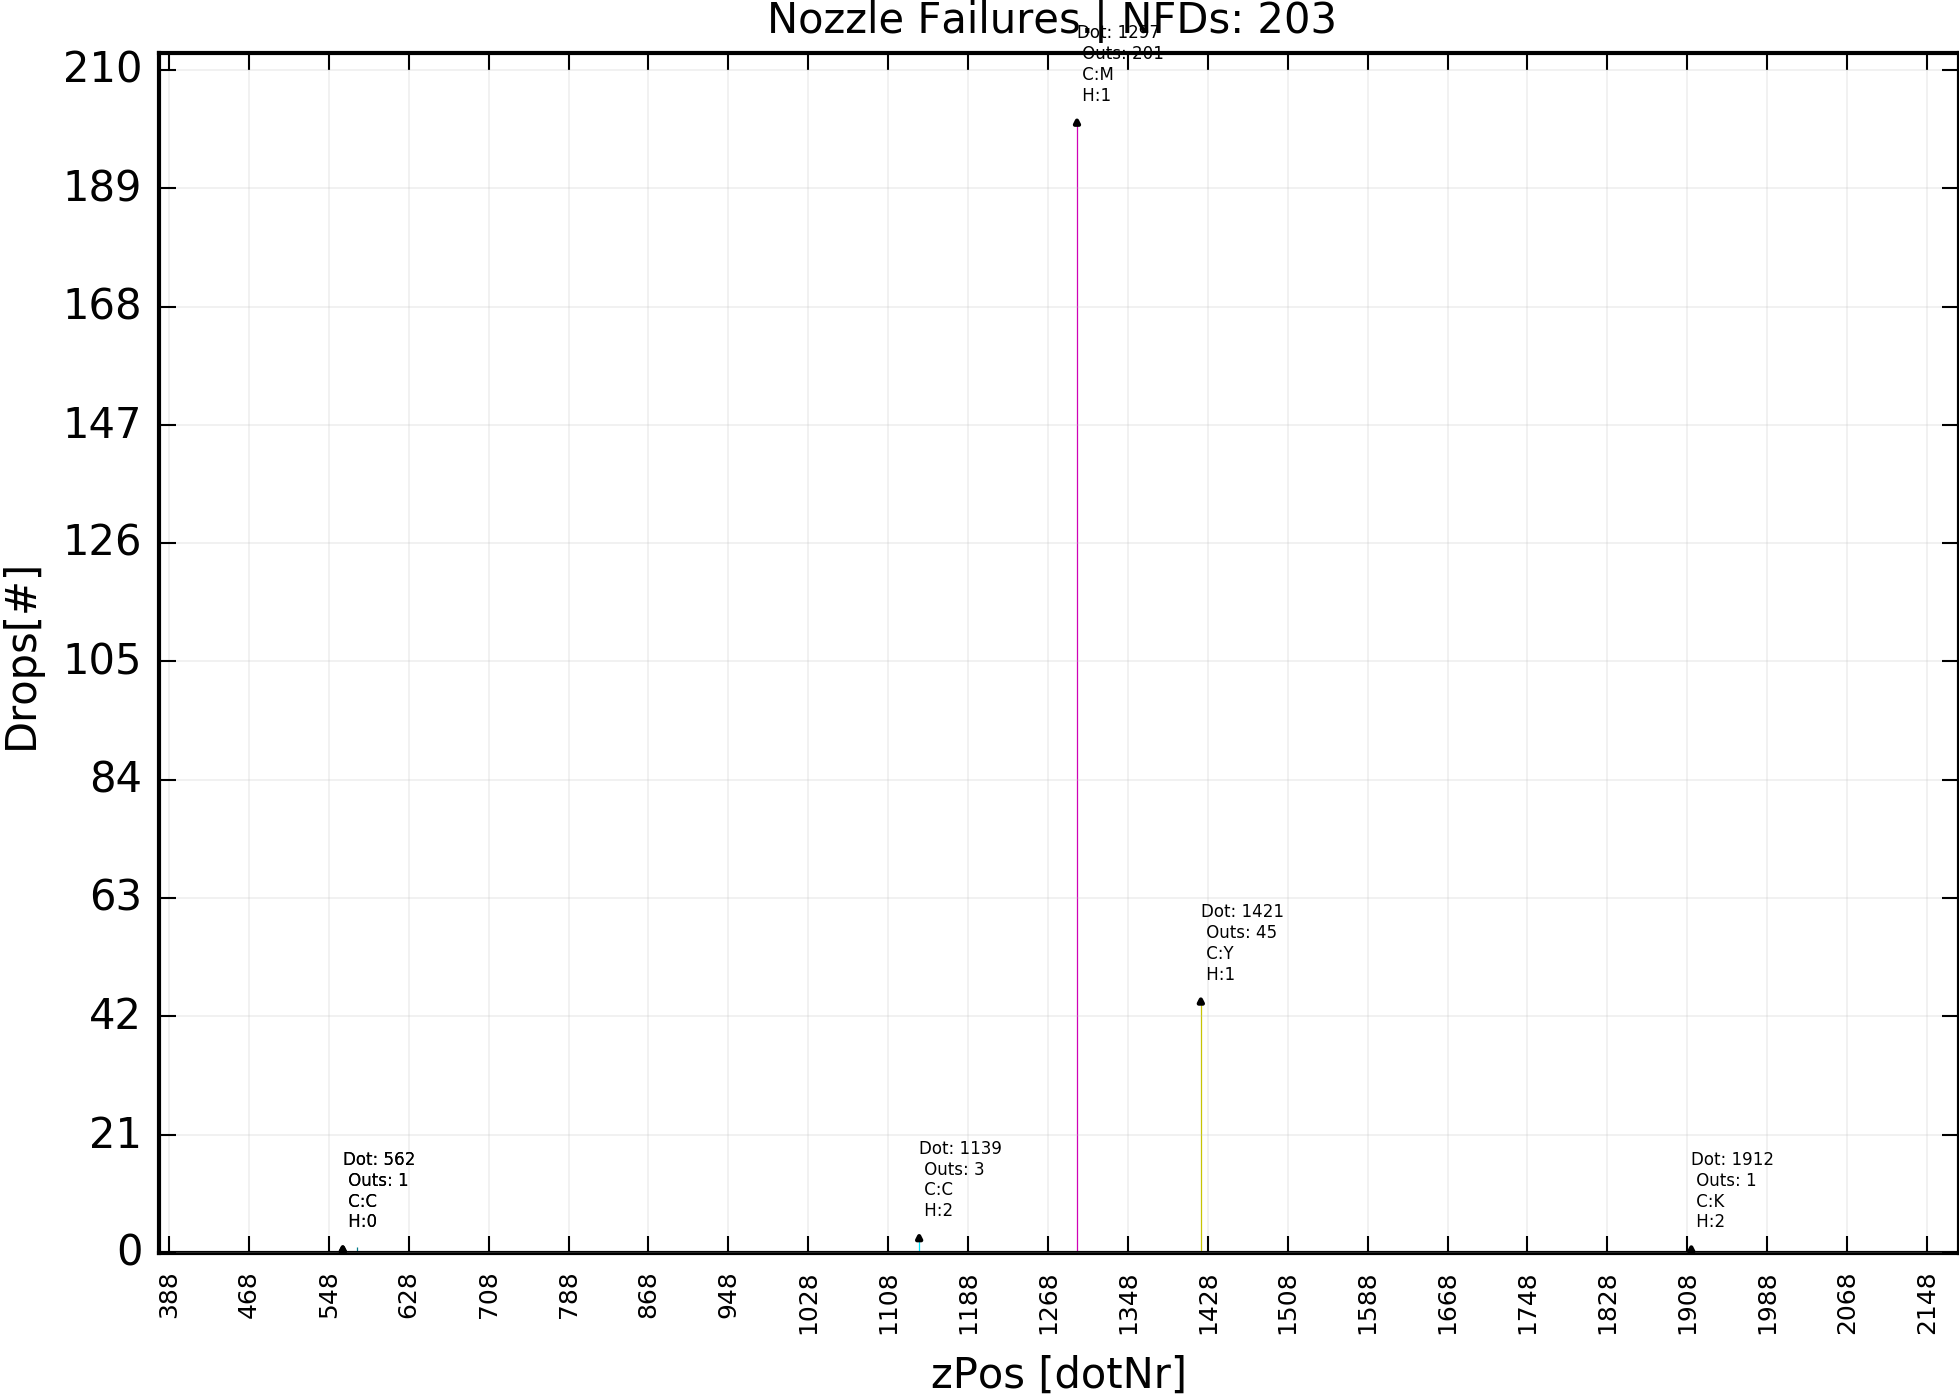
Attached I have a .csv with the data (nozzle failures from print head 0,1,2 and colors K,C,M,Y). I want to recreate the matplotlib bar chart (see .png).
I get stuck if I use your Bar chart API, so then I tried using a scatterplot with which I can get it to work almost. I need to get to a state where if a nozzle (dot) is tapped (or box-selected), more data on this nozzle will be plotted, in this case a timeframe of the failure.
Below the code:
note: apparently I need to convert my dataFrame to an orderedDict (=xyvalues)?
Issues: 1. hovering works partially. 2. not sure how to implement a callback (callback=CustomJS.from_py_func(callback)) 3. a bar plot would be nicer.
"""
from bokeh.charts import Scatter, output_file, show, defaults, output_notebook
from bokeh.charts.operations import blend
from bokeh.charts.attributes import cat, color
from bokeh.models import CustomJS, ColumnDataSource
print("Bokeh version: %s" %bokeh.__version__)
print("Panda version: %s" %pd.__version__)
defaults.width = 600
defaults.height = 600
output_notebook()
colorRange=['#3D3D3D','#8A8A8A','#BABABA','#017C8A','#04B1C4','#00E5FF',
'#A80095','#CF02B7','#FF00E1','#A8A602','#C7C402','#E3DF00']
source = ColumnDataSource(data=xyvalues)
scatter = Scatter(xyvalues, x='x', y=blend('K0','K1','K2','C0','C1','C2','M0','M1','M2','Y0','Y1','Y2', name='colorhead', labels_name='ch'),
color=color(columns='ch', palette=colorRange,
sort=False),
title="Nozzle Failures",
#label=cat(columns='x', sort=False),
xlabel="zPos[dotNr]",
ylabel="Drops[#]",
legend='top_right',
tooltips=[('colorHead', '@ch'), ('dotNumber', '@x')]
)
output_file('NozzleFailure.html')
show(scatter)
""""
I would say I have more options defining a figure and use .circle , but this one does not support blends?
I look forward to your response.
Vriendelijke groeten,
Best wishes,
Rakesh Partapsing
Data Scientist • Machine & Technology Development 1-4
Océ-Technologies B.V. • A Canon Group Company
P.O. Box 101 • 5900 MA Venlo
St. Urbanusweg 43 • 5914 CA Venlo • The Netherlands
T +31 (0)77 359 - • M +31 (0)6 123 97 164
E [email protected] • W www.oce.com
Trade Register: 12002662
On Fri, Mar 18, 2016 at 4:51 PM, Bryan Van de Ven <[email protected]> wrote:
Hi Rakesh,
Bokeh is a large project, with different parts that have different levels of stability and maturity. Getting things right sometimes means experimenting and seeing what works for a time, which sometimes means breaking APIs. We try to minimize this, of course, because it can understandably be frustrating, but sometimes it is unavoidable if forward progress is to continue. This has been particularly true of the bokeh.charts interface, which is the newest and least mature API. The bokeh.charts API has started to stabilize much more redently, but the internet remembers everything, including old and outdated things that are no longer relevant. My recommendation is to use the official docs (for the version of Bokeh you are using) and the mailing list as much as possible, especially with bokeh.charts questions.
Thanks,
Bryan
> On Mar 18, 2016, at 4:51 AM, [email protected] wrote:
>
> Hi Sarah, I can't seem to get this code working with bokeh 0.11 python 3.5. Error: 'NoneType' object is not iterable. What happened w.r.t. the prev. bokeh versions?
> (I have this issue with a lot of code I find on the internet on Bokeh plots, just copy pasting it and an error occurs
>
> I'm looking forward to your response.
>
> Rakesh
>
> On Wednesday, August 5, 2015 at 6:19:27 PM UTC+2, Sarah Bird wrote:
> This is happening because names isn't a column on the data source that's driving your plot.
>
> The short answer is use @cat.
>
> You can see the data source that's driving the plot as follows:
>
> glyph_ renderers = bar.select(dict(type=GlyphRenderer))
> bar_source = glyph_renderers[0].data_source
>
> bar_source.column_names
> or
> bar_source.data
>
> Hope that helps.
>
> On Wed, Aug 5, 2015 at 5:22 PM, Kevad <[email protected]> wrote:
> Hello,
>
> I have a data in which one column is a list of names. Can I make a custom hover tooltip for bar charts to work ?
>
> from bokeh.charts import Bar
> from bokeh.models import HoverTool
>
> numbers = [1, 2, 3, 4, 5]
> names = ['a', 'b', 'c', 'd', 'e']
>
> bar = Bar(numbers, names, tools='hover')
> hover = bar.select(dict(type=HoverTool))
>
> hover.tooltips = [
> ('position', '$index'),
> ('name',' @names'),
> ]
>
> show(bar)
>
> For position, the hover is working fine, but for 'name' it shows '???'. Any idea how to make it work ? Or am I making something wrong ?
>
>
> Thanks,
> Kevad.
>
> --
> You received this message because you are subscribed to the Google Groups "Bokeh Discussion - Public" group.
> To unsubscribe from this group and stop receiving emails from it, send an email to bokeh+un...@continuum.io.
> To post to this group, send email to bo...@continuum.io.
> To view this discussion on the web visit https://groups.google.com/a/continuum.io/d/msgid/bokeh/fc7723e4-2172-429e-be5e-5f3c3b78af1f%40continuum.io\.
> For more options, visit https://groups.google.com/a/continuum.io/d/optout\.
>
>
> --
> You received this message because you are subscribed to the Google Groups "Bokeh Discussion - Public" group.
> To unsubscribe from this group and stop receiving emails from it, send an email to [email protected].
> To post to this group, send email to [email protected].
> To view this discussion on the web visit https://groups.google.com/a/continuum.io/d/msgid/bokeh/d11b0b07-ac08-41ec-af01-671bf0b2f61a%40continuum.io\.
> For more options, visit https://groups.google.com/a/continuum.io/d/optout\.
> <bokehError.png>
--
You received this message because you are subscribed to a topic in the Google Groups "Bokeh Discussion - Public" group.
To unsubscribe from this topic, visit https://groups.google.com/a/continuum.io/d/topic/bokeh/-aDPTqDPA3M/unsubscribe\.
To unsubscribe from this group and all its topics, send an email to [email protected].
To post to this group, send email to [email protected].
To view this discussion on the web visit https://groups.google.com/a/continuum.io/d/msgid/bokeh/CAB85EDA-40B6-4AE7-8365-358B75FB8203%40continuum.io\.
For more options, visit https://groups.google.com/a/continuum.io/d/optout\.
This message and attachment(s) are intended solely for use by the addressee and may contain information that is privileged, confidential or otherwise exempt from disclosure under applicable law. If you are not the intended recipient or agent thereof responsible for delivering this message to the intended recipient, you are hereby notified that any dissemination, distribution or copying of this communication is strictly prohibited. If you have received this communication in error, please notify the sender immediately by telephone and with a 'reply' message. Thank you for your co-operation.
--
You received this message because you are subscribed to the Google Groups "Bokeh Discussion - Public" group.
To unsubscribe from this group and stop receiving emails from it, send an email to [email protected].
To post to this group, send email to [email protected].
To view this discussion on the web visit https://groups.google.com/a/continuum.io/d/msgid/bokeh/44BC8A2AF5DF0944A16CDD965A69F1A114228393%40oce-exmb01-v.oce.net\.
For more options, visit https://groups.google.com/a/continuum.io/d/optout\.
<DataToBePlottedInBarChart.csv><matplotlibgraph.png>