This is happening because names isn’t a column on the data source that’s driving your plot.
The short answer is use @cat.
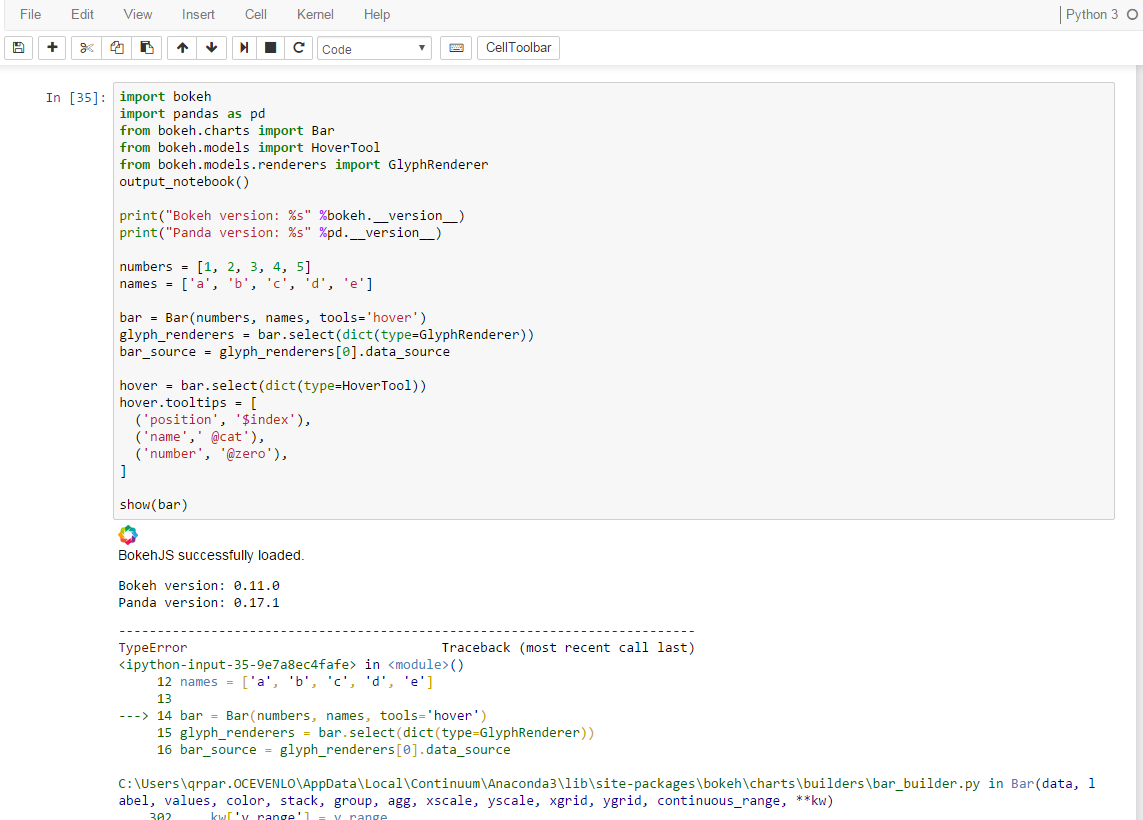
You can see the data source that’s driving the plot as follows:
glyph_ renderers = bar.select(dict(type=GlyphRenderer))
bar_source = glyph_renderers[0].data_source
bar_source.column_names
or
bar_source.data
Hope that helps.
···
On Wed, Aug 5, 2015 at 5:22 PM, Kevad [email protected] wrote:
Hello,
I have a data in which one column is a list of names. Can I make a custom hover tooltip for bar charts to work ?
from bokeh.charts import Bar
from bokeh.models import HoverTool
numbers = [1, 2, 3, 4, 5]
names = ['a', 'b', 'c', 'd', 'e']
bar = Bar(numbers, names, tools='hover')
hover = bar.select(dict(type=HoverTool))
hover.tooltips = [
('position', '$index'),
('name',' @names'),
]
show(bar)
For position, the hover is working fine, but for ‘name’ it shows ‘???’. Any idea how to make it work ? Or am I making something wrong ?
Thanks,
Kevad.
–
You received this message because you are subscribed to the Google Groups “Bokeh Discussion - Public” group.
To unsubscribe from this group and stop receiving emails from it, send an email to [email protected].
To post to this group, send email to [email protected].
To view this discussion on the web visit https://groups.google.com/a/continuum.io/d/msgid/bokeh/fc7723e4-2172-429e-be5e-5f3c3b78af1f%40continuum.io.
For more options, visit https://groups.google.com/a/continuum.io/d/optout.