On Jul 7, 2016, at 10:41 PM, Lars Johannes <[email protected]> wrote:
Hi Bryan,
Thanks a lot for the quick reply, this is really much appreciated! This is the code. I tried to pare it down to the relevant bits. Whatever I try, I get one of two results. Either the axis ranges remain constant across indicators or they are defined contextually and change with every update.
#data is a Pandas data frame
# Define widgets using start/end years derived from data
x_axis = Select(title='X-Axis', options=sorted(axis_map.keys()), value = 'GDP per capita (current US$)')
y_axis = Select(title='Y-Axis', options=sorted(axis_map.keys()), value = 'Life expectancy at birth, total (years)')
years = Slider(title = 'Year', start = start_yr.value, end = end_yr.value, value = (end_yr.value), step=1)
# Set up data source for interactive dashboard
source = ColumnDataSource(data=dict(x=,y=, year=, country=, color=, alpha=, region=))
#Define figure
p = Figure(plot_height=600, plot_width=700, title="")
p.circle(x="x", y="y", source=source, size="alpha", color="color", line_color=None, fill_alpha=1)
# the next two lines I have added to test first your suggestion - no luck
p.x_range = Range1d(start = float(ranges.loc[x_axis.value,"Min"]), end = float(ranges.loc[x_axis.value,"Max"]))
p.y_range = Range1d(start = float(ranges.loc[y_axis.value,"Min"]), end = float(ranges.loc[y_axis.value,"Max"]))
# update function 0 for some reason the axis label stuff works but the axis range not
def update():
df = select_indicator()
p.xaxis.axis_label = x_axis.value
p.yaxis.axis_label = y_axis.value
# also tried this with p.x_range.start/end
p.x_range = Range1d(start = float(ranges.loc[x_axis.value,"Min"]), end = float(ranges.loc[x_axis.value,"Max"]))
p.y_range = Range1d(start = float(ranges.loc[y_axis.value,"Min"]), end = float(ranges.loc[y_axis.value,"Max"]))
source.data = dict(...)
# the rest is fairly standard (and mostly derived from your examples)
controls = [x_axis, y_axis, start_yr, end_yr, years]
for control in controls:
    control.on_change('value', lambda attr, old, new: update())
update()
widgets = VBox(x_axis, y_axis, start_yr, end_yr, years)
layout = hplot(widgets, p)
curdoc().add_root(layout)Enter code here...
Also attaching the complete code as .txt for reference.
Best,
Lars
On Friday, July 8, 2016 at 10:49:08 AM UTC+8, Bryan Van de ven wrote:
Lars,
This simple example works perfectly as expected:
import numpy as np
from bokeh.plotting import figure
from bokeh.models import Range1d
from bokeh.io import curdoc
x = np.linspace(0, 100, 1000)
y = np.sin(x)
p = figure(x_range=(0, 100))
p.circle(x, y)
def cb():
# this works:
p.x_range.start += 1
p.x_range.end += 1
# this also works:
#p.x_range = Range1d(p.x_range.start+1, p.x_range.end+1)
curdoc().add_periodic_callback(cb, 200)
curdoc().add_root(p)
So, I'd have to see more of your code to see what might be going wrong in your particular case.
Thanks,
Bryan
> On Jul 7, 2016, at 9:04 PM, Bryan Van de Ven <[email protected]> wrote:
>
> Did you start out by providing explicit ranges when you created the figure? If not, figures get auto-ranging DataRange1d objects by default. It's possible there is a problem with replacing DataRanges somehow. You could try setting .start and .end on the existing range (instead of replacing the entire range object as you are doing now), or making sure to explicitly give fixed Range1d bounds when you create plot.
>
> If those fix the problem then this is probably a bug and an issue with a minimal complete test case would be appreciated.
>
> Thanks,
>
> Bryan
>
>> On Jul 7, 2016, at 9:00 PM, Lars Johannes <[email protected]> wrote:
>>
>> Hi,
>>
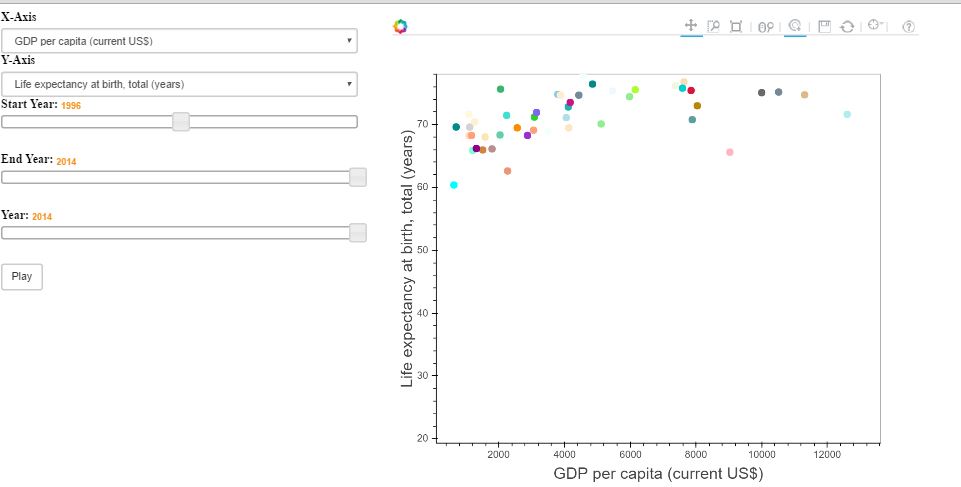
>> I am trying to implement an interactive dashboard in Bokeh with a "play" functionality that loops through all value pairs for two indicators selected by widgets.
>>
>>
>>
>>
>>
>> While the loop works, the dashboard resets the axis values for each step of the loop. So what I need is to set axis values based on the widget.value selected. To do this, I have built a data frame "ranges" that has the name of the indicator as index and the min/max value for each indicator as columns. So when setting the ranges, the code is supposed to check the indicator name in ranges and retrieve the value for max and min. The relevant code (ranges.loc[x_axis.value,"Min"]) does produce the correct numbers.
>>
>>
>>
>> The updates for controls work thusly (x_axis,etc. are the names of the widgets):
>>
>> controls = [x_axis, y_axis, start_yr, end_yr, years]
>> for control in controls:
>>
>> control
>> .on_change('value', lambda attr, old, new: update())
>>
>>
>> The update function is supposed to update the ranges upon change in the controls like this:
>>
>> def update():
>>
>>
>> p
>> .x_range = Range1d(start = ranges.loc[x_axis.value,"Min"],
>>
>> end
>> = ranges.loc[x_axis.value,"Max"])
>>
>> p
>> .y_range = Range1d(start = ranges.loc[y_axis.value,"Min"],
>>
>> end
>> = ranges.loc[y_axis.value,"Max"])
>>
>>
>> What should happen: Whenever I change the value of the widget, the ranges should update, but other than that, they should remain constant
>>
>>
>>
>> What does happen: The ranges are set based on the value of the widget initially set and don't change on update. However, I am able to update the axis names using this approach for some reason.
>>
>>
>>
>> I've tried to find examples trying to achieve something similar but no luck. Any pointers would be highly appreciated.
>>
>>
>> --
>> You received this message because you are subscribed to the Google Groups "Bokeh Discussion - Public" group.
>> To unsubscribe from this group and stop receiving emails from it, send an email to bokeh+un...@continuum.io.
>> To post to this group, send email to bo...@continuum.io.
>> To view this discussion on the web visit https://groups.google.com/a/continuum.io/d/msgid/bokeh/1015993e-0631-4320-a070-91ce24586048%40continuum.io\.
>> For more options, visit https://groups.google.com/a/continuum.io/d/optout\.
>
--
You received this message because you are subscribed to the Google Groups "Bokeh Discussion - Public" group.
To unsubscribe from this group and stop receiving emails from it, send an email to [email protected].
To post to this group, send email to [email protected].
To view this discussion on the web visit https://groups.google.com/a/continuum.io/d/msgid/bokeh/ca6ac708-1050-4039-9b43-bc533540533a%40continuum.io\.
For more options, visit https://groups.google.com/a/continuum.io/d/optout\.
<LJ WB_DB.txt>