Bokeh version 2.4.3
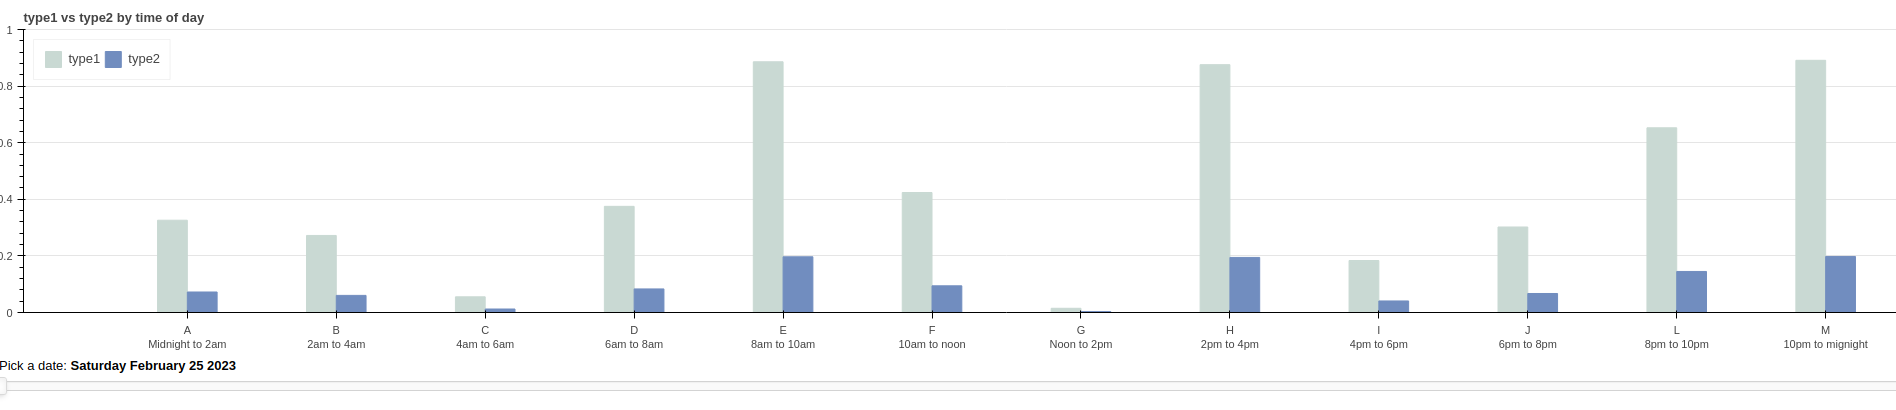
I have a dataset consisting of 2-hourly output values for 2 types of machines, so 12 values for each machine per day. I plot them for a given day using a Bokeh vbar plot, as per the screenshot.
I have data for multiple days, so I was hoping to be able to select a day using dateSlider and have the plot update to show the data for whichever day I use the slider to select.
My code is below. My issue is, even though the callback seems to update the data the way I want, in that it console.logs what I expect when I drag the slider to a given date, there is no effect on the plot.
import numpy as np
import pandas as pd
from bokeh.models import ColumnDataSource
from bokeh.plotting import figure, show
from bokeh.transform import dodge, factor_cmap
from bokeh.models.callbacks import CustomJS
from bokeh.layouts import layout, column

from bokeh.models.widgets import DateSlider

from bokeh.palettes import GnBu3, OrRd3

d1 = {'type1': [0.8257115749525616, 0.8258538899430741, 0.8257115749525616, 0.8257115749525616, 0.8256641366223909, 0.8261385199240987, 0.8261859582542694, 0.8261385199240987, 0.8268026565464897, 0.8272770398481973, 0.8269924098671726, 0.8267552182163188, 0.8268026565464897, 0.827134724857685, 0.8268026565464895, 0.8268975332068311, 0.8268026565464895, 0.8266129032258065, 0.8273719165085389, 0.8274193548387097, 0.8268500948766604, 0.8265654648956356, 0.8263757115749526, 0.8267552182163188], 'type2': [0.09401622718052738, 0.10567951318458418, 0.17505070993914806, 0.29137931034482756, 0.23742393509127788, 0.09036511156186613, 0.09837728194726167, 0.10588235294117648, 0.07505070993914807, 0.12454361054766735, 0.2553752535496957, 0.45162271805273835, 0.5705882352941176, 0.7185598377281948, 0.731947261663286, 0.579107505070994, 0.5619675456389452, 0.5545638945233267, 0.5598377281947262, 0.36663286004056794, 0.33113590263691683, 0.23113590263691686, 0.16643002028397566, 0.15933062880324544], 'day': [1677283200000.0, 1677283200000.0, 1677283200000.0, 1677283200000.0, 1677283200000.0, 1677283200000.0, 1677283200000.0, 1677283200000.0, 1677283200000.0, 1677283200000.0, 1677283200000.0, 1677283200000.0, 1677369600000.0, 1677369600000.0, 1677369600000.0, 1677369600000.0, 1677369600000.0, 1677369600000.0, 1677369600000.0, 1677369600000.0, 1677369600000.0, 1677369600000.0, 1677369600000.0, 1677369600000.0], 'time_of_day': ['A\nMidnight to 2am', 'B\n2am to 4am', 'C\n4am to 6am', 'D\n6am to 8am', 'E\n8am to 10am', 'F\n10am to noon', 'G\nNoon to 2pm', 'H\n2pm to 4pm', 'I\n4pm to 6pm', 'J\n6pm to 8pm', 'L\n8pm to 10pm', 'M\n10pm to mignight', 'A\nMidnight to 2am', 'B\n2am to 4am', 'C\n4am to 6am', 'D\n6am to 8am', 'E\n8am to 10am', 'F\n10am to noon', 'G\nNoon to 2pm', 'H\n2pm to 4pm', 'I\n4pm to 6pm', 'J\n6pm to 8pm', 'L\n8pm to 10pm', 'M\n10pm to mignight']}
d2 = {'type1': [0.3261287207863031, 0.27226244680837386, 0.055406015757283045, 0.3751453526115819, 0.8859150568977306, 0.42393128654219664, 0.014948390966778259, 0.8756807852660252, 0.18368866537360964, 0.30216318292301436, 0.6526416733411314, 0.8911577659955132], 'type2': [0.07247304906362291, 0.06050276595741642, 0.012312447946062899, 0.08336563391368486, 0.19687001264394013, 0.0942069525649326, 0.0033218646592840574, 0.19459573005911673, 0.040819703416357704, 0.06714737398289208, 0.1450314829646959, 0.19803505911011407], 'day': [1669593600000.0, 1669593600000.0, 1669593600000.0, 1669593600000.0, 1669593600000.0, 1669593600000.0, 1669593600000.0, 1669593600000.0, 1669593600000.0, 1669593600000.0, 1669593600000.0, 1669593600000.0], 'time_of_day': ['A\nMidnight to 2am', 'B\n2am to 4am', 'C\n4am to 6am', 'D\n6am to 8am', 'E\n8am to 10am', 'F\n10am to noon', 'G\nNoon to 2pm', 'H\n2pm to 4pm', 'I\n4pm to 6pm', 'J\n6pm to 8pm', 'L\n8pm to 10pm', 'M\n10pm to mignight']}

source3 = ColumnDataSource(data=d2)

tod = d2['time_of_day']

p = figure(x_range=tod, y_range=(0, 1), title='type1 vs type2 by time of day',
           height=350, width=2000, toolbar_location=None, tools="", )

p.vbar(x=dodge('time_of_day', -0.1, range=p.x_range), top='type1', source=source3,
       width=0.2, color="#c9d9d3", legend_label='type1')

p.vbar(x=dodge('time_of_day',  0.1,  range=p.x_range), top='type2', source=source3,
       width=0.2, color="#718dbf", legend_label='type2')

p.x_range.range_padding = 0.1
p.xgrid.grid_line_color = None
p.legend.location = "top_left"
p.legend.orientation = "horizontal"

day_in_ms = 86400000
source = ColumnDataSource(d1)
source2 = ColumnDataSource(d1)

callback = CustomJS(args=dict(source=source, source2=source2),
                    code="""
    console.log(source.data);
    const data = source.data;
    const data2 = source2.data;
    const D = cb_obj.value;
    const test_st = data2['day'].indexOf(D)

    const x = data2['day'];
    const data_day_len = data2['day'].length;
    //let unique = x.filter((item, i, ar) => ar.indexOf(item) === i);

    const ok = Object.keys(data)
    function update_data() {
        function bind_ts(){
            const st = x.indexOf(D);
            const en = st + 12;
            ok.forEach((key) => {
            console.log(D, st, en);
            data[key] = [];
            data[key] = data2[key].slice(st, en);
            });
        return data;
    }
    return bind_ts();
    }
    update_data();
    console.log(source.data);

    source.change.emit();
""")

start = d2['day'][0]
end = d2['day'][-1]
date_slider = DateSlider(start=d1['day'][0], end=d1['day'][-1], value=d1['day'][0], step=86400000, format='%A %B %d %Y', title='Pick a date')
date_slider.js_on_change('value', callback)
layout = layout(p, date_slider)
show(layout)
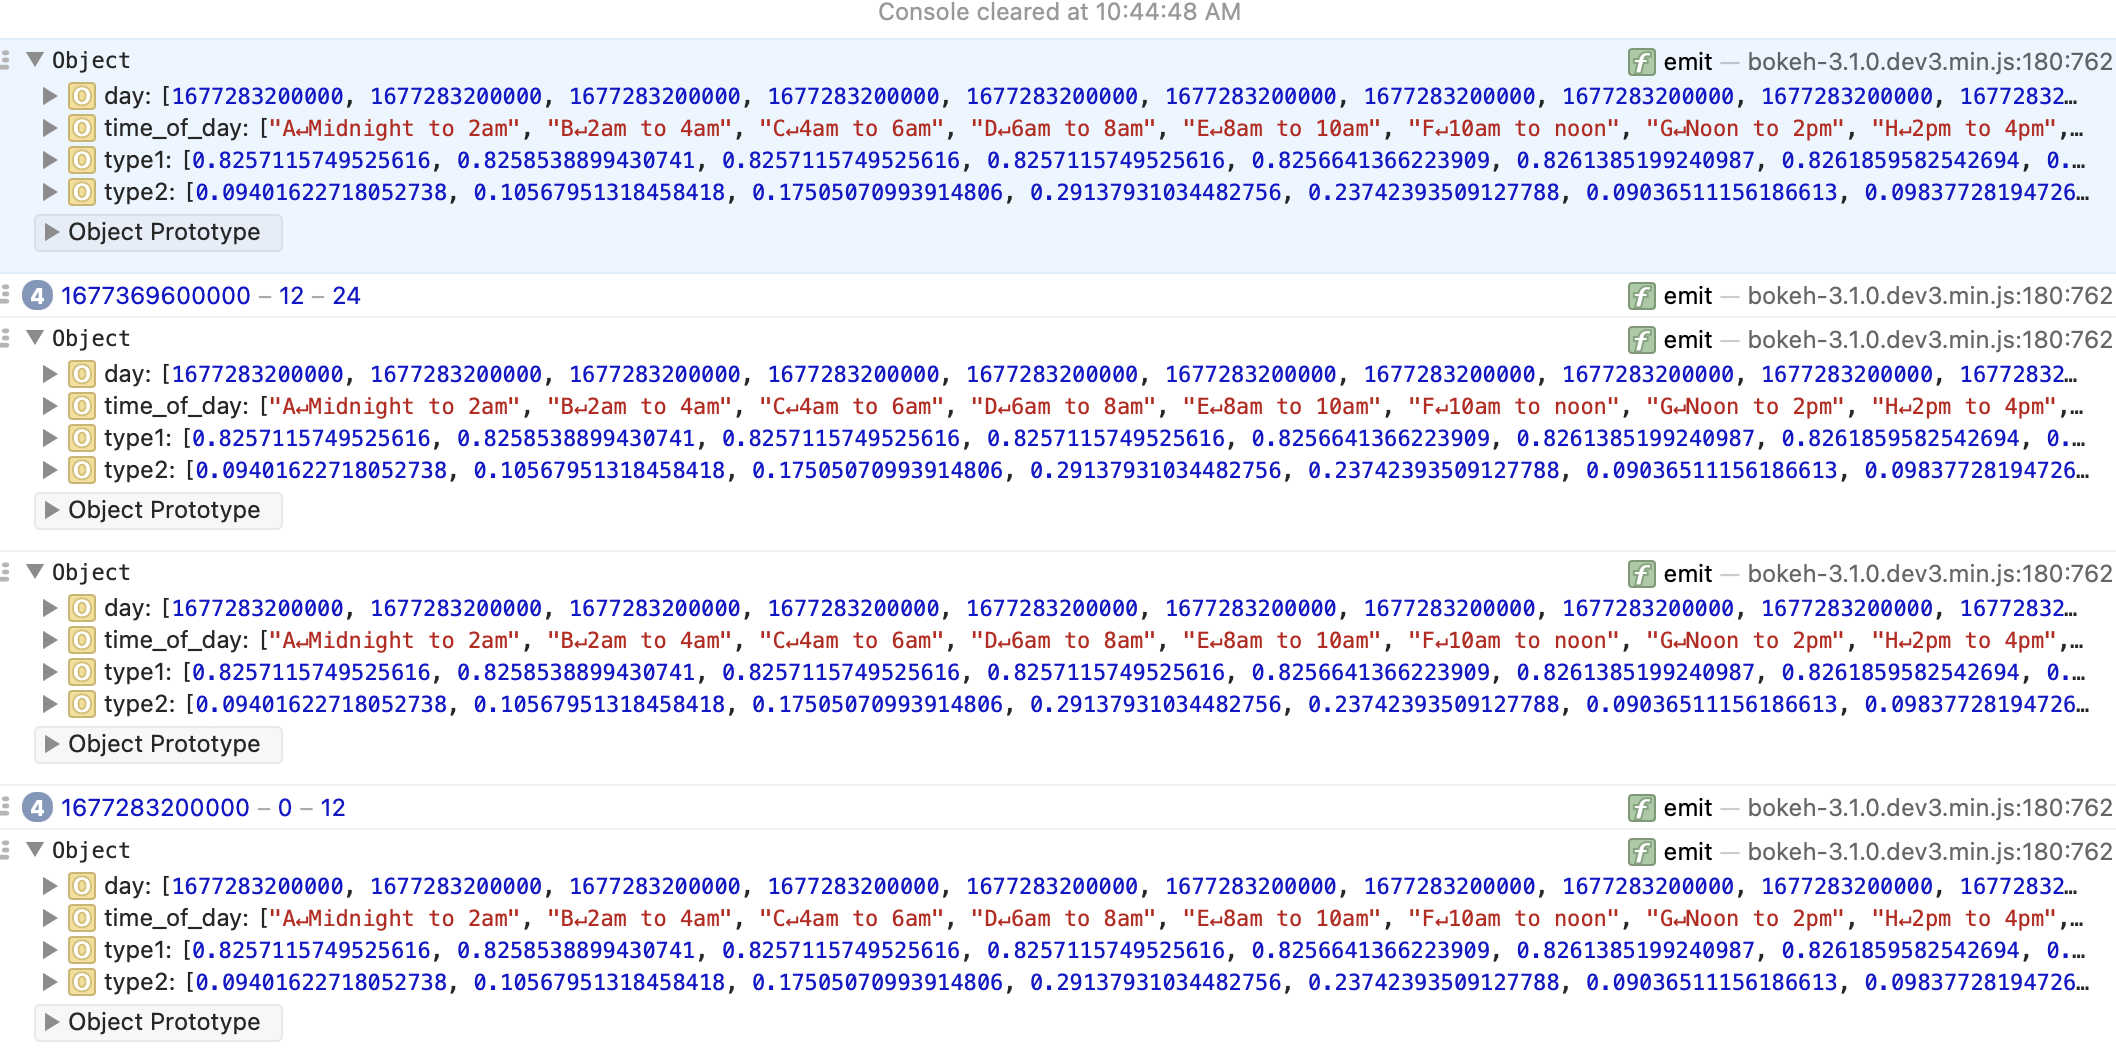
The last console.log shows that “source” is updating, in that it now indicates the data correctly corresponds to the cb_obj value, though I’m not sure that technically that’s right. In fact I’m pretty sure that’s wrong!
Any ideas why this isn’t working?