Hi,
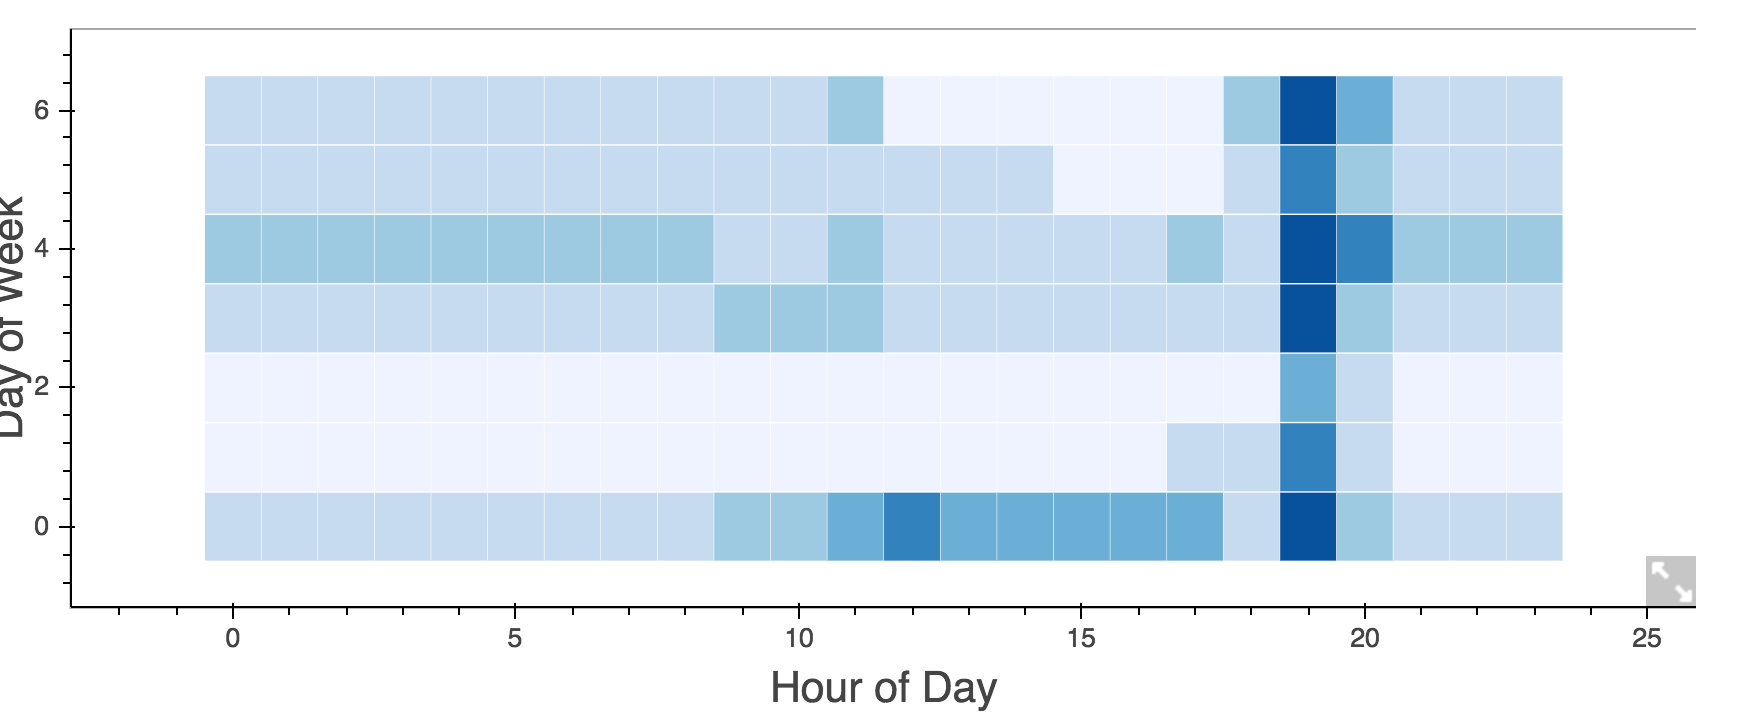
I’m working on a project where I use Flask to show some visualizations that I’ve created using a Bokeh, giving it a Pandas dataframe, to the screen. When I started, I created the charts using snippets. I noticed then that the length and width of the chart that I entered as variables did not seem to influence the size of the chart on the page, but it was a legible chart. Then I grouped two charts together with gridplot() and found that the x axis don’t coordinate. The charts are the same size, but the heatmap seems to have some kind of internal padding in its frame which makes the actual data region smaller than it should be.
After reading up a bit, I went from snippets to components because it seemed like I might have a bit more control over this padding. Then, the charts started to render as minuscule, and I couldn’t seem to get them to size themselves properly. I have tried tons of suggestions of how to make sure the height of a div in bootstrap takes up enough of a page for the charts to render, but when I did get it working (by using a lot of height: 100% values in CSS), the charts just decided to put padding around themselves and stayed the same size.
I’m now a little frustrated and feel like I’ve iterated so much, I’m just not sure how to troubleshoot. So, here is the basic code.
plot code:
def build_plot(df_total, df_stations):

    hm = HeatMap(df_total, x='hod', y='dow', values='count', stat=None, xlabel="Hour of Day", ylabel="Day of Week",
                 tools=[ResizeTool(), HoverTool(), PanTool(), PreviewSaveTool(), ResetTool()], hover_text='count',
                 color=brewer['Blues'], responsive=True, plot_width=1500, plot_height=750, min_border=0)

    output_file('heatmap.html', title='Listening Times')

    bp = Bar(df_stations, values='count', label='hod', stack='stations', tools=[ResizeTool(), HoverTool(),
                                                                                PanTool(), PreviewSaveTool(),
                                                                                ResetTool()], legend=True,
             responsive=True, plot_width=1500, plot_height=750)
    bp.select(dict(type=HoverTool)).tooltips={"station":"$stations", "hod":"$hod", "count": "$count"}

    p = gridplot([[hm], [bp]])

    return components(p)
The plot_width and plot_height are absolutely not having an impact, so that’s why they might seem a bit big. I was testing out whether it would influence anything. This is true both in the snippet and in the components.
flask code:
@app.route(’/index’)
``
def index():
    '''
    '''

    return render_template('index.html')

@app.route('/call_db', methods=['POST'])
def get_data():

    df_total, df_stations = total_interactions(request.form['text'])
    if isinstance(df_stations, basestring):
        return render_template('index.html', error_msg= request.form['text'] + " has no data")
    plot_script, plot_div = build_plot(df_total, df_stations)
    return render_template('index.html', plot_div = plot_div, plot_script=plot_script)
This works as expected.
relevant html code:
                <div class="brand">
                  <h3
                    style="display: inline-block; text-align: left; color: Brown; font-weight: bold;"
                    title="SUV Tool">SUV Tool</h3>

                </div>
            </div>
            <div class="col-md-9 col-sm-7">
            </div>
        </div>
     <div class="row" id="main">
        <div class="col-sm-5 col-md-3">
                <div class="row">
                    <form id="id_entry" action="/call_db" method="POST">
                      <div class="form-group">
                        <label for="idinput">ID</label>
                        <input type="text" class="form-control" name="text" id="idinput" placeholder="ID">
                      </div>
                      <button type="submit" class="btn btn-default submit-btn" value="Echo">Submit</button>
                    </form>
                           {% if error_msg %}
                                {{ error_msg|safe }}
                            {% endif %}
                </div>
                <div class="row">
                </div>
             </div>

        <div class="col-sm-7 col-md-9" id="charts">
                            {% if plot_div %}
                                {{ plot_div|safe }}
                            {% endif %}
              </div>
            </div>
</div>
``
css:
html,
body {
    height: 100%;
    /* The html and body elements cannot have any padding or margin. */

}

/* Custom page CSS
-------------------------------------------------- */
/* Not required for template or sticky footer method. */

code {
    font-size: 80%;
}

.btn-secondary {
  background-color: #800000;
  color: black;
}

.container-fluid {
  width: 100%;
  min-height: 100%;
  height: 100% !important;
}

.row{
    overflow: hidden;
    padding-left:15px;
}

[class*="col-"]{
    margin-bottom: -99999px;
    padding-bottom: 99999px;
}

#main {
    height:100%;
  }

}
``
The row CSS is just one in my latest attempts to get the everything to size properly. I’ve gone through and removed things that were sending me down a rabbit hole, like making everything size 100% even in the embedded html. I have a CSS guru coming to help me this afternoon. But, I don’t know that this is necessarily CSS fixable.
That is the totality of my issue. I have no idea if anyone can help me, but it’s better than pulling my hair out. Thanks in advance.