Hello all, I’ve noticed something strange in Bokeh version 2.4.2 when using webgl as the output backend. I first noticed this issue when plotting many month’s worth of hourly data in a bokeh plot embedded in a flask app I’ve created, but it appears in even simple examples like the one I will share below.
When a perfectly horizontal line is plotted using webgl as the output backend, the figure renders the line as dashed at each x value no matter what type of “line_dash” style is supplied. If I don’t use webgl as the backend, the line is solid and if I supply a different “line_dash” style it renders correctly. This problem is only present when a line is horizontal, not when the y value changes with each x value.
Here is a minimal working example that illustrates the behavior:
from bokeh.plotting import figure
from bokeh.io import show
from bokeh.models import ColumnDataSource
from numpy.random import random_sample

x = list(range(20))

y1 = [.5] * 12
y2 = random_sample((1, 8)).tolist()[0]
y = y1 + y2

source = ColumnDataSource({'x': x, 'y': y})

fig = figure(
    height=230, width=700, background_fill_color='#fafafa',
    toolbar_location=None,
    output_backend='webgl',
)

line = fig.line(
    x='x', y='y', source=source, color='black',
    line_width=3, line_dash='solid',
)

show(fig)
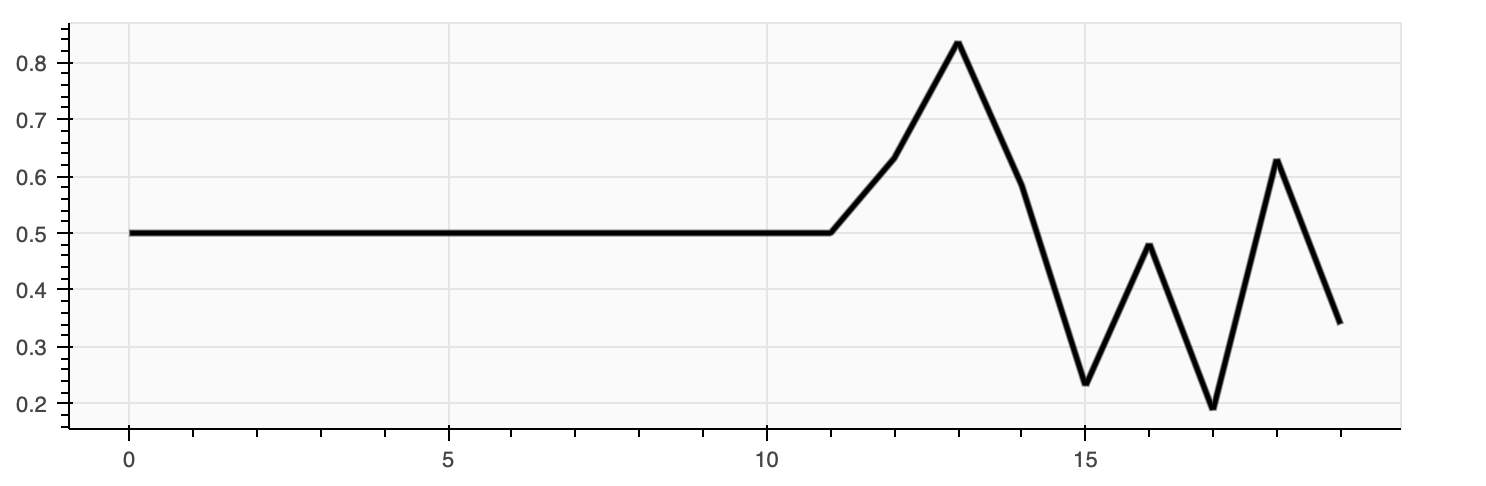
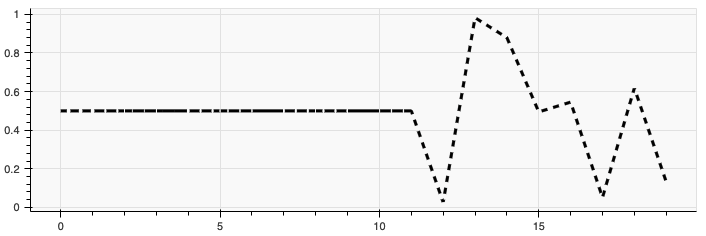
With webgl as the backend, here is example output of the code above:
As you can see, the horizontal part of the plot is dashed at x ticks 1, 2, 3, etc. and the issue disappears when different y values are plotted for each x value.
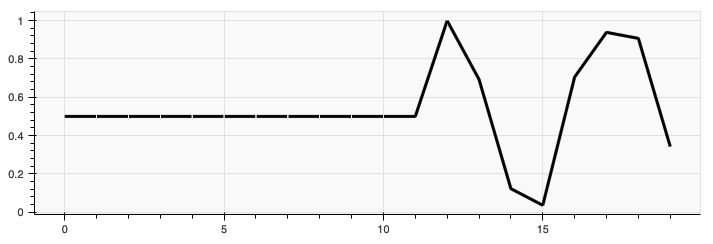
If I comment out the output_backend='webgl', section of code, we get a plot that renders correctly:
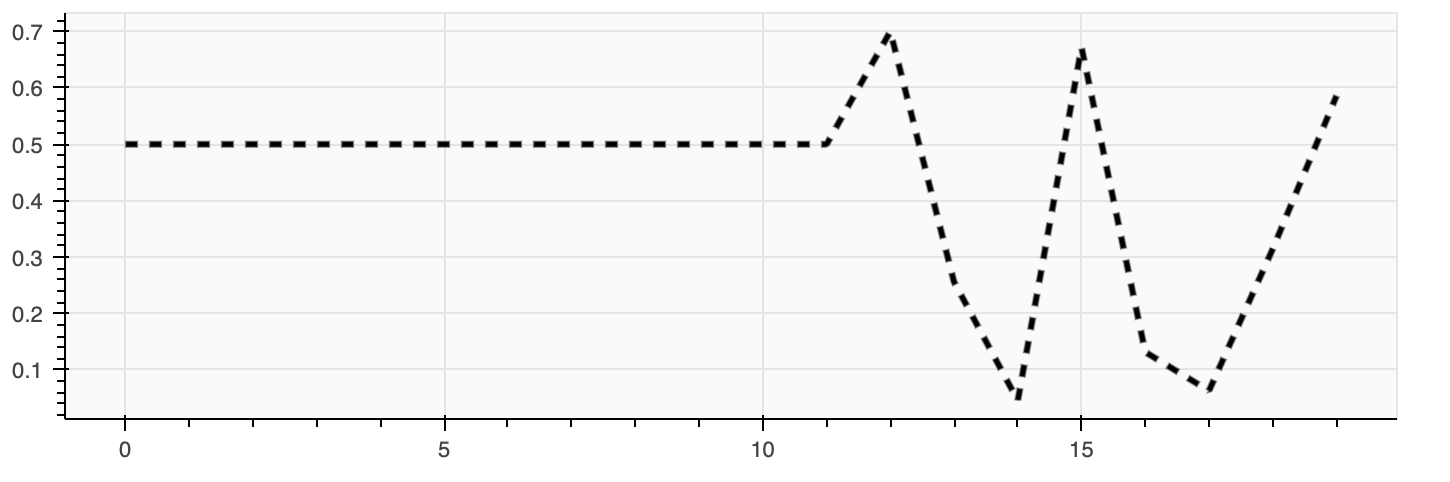
And lastly, if webgl is the output backend and I use a different line_dash style than “solid” things really get weird! Here’s the plot with webgl on and a “dashed” line_dash:
Anybody know what’s going on here? I’m not familiar at all with webgl and I want to use it to speed up my plot rendering of many thousands of data points. I’m not sure if this is a bug or not, or if I’m doing something wrong, but any help would be great!