Hi,
from your documentation example Handling categorical data — Bokeh 2.4.2 Documentation there is the following code:
from bokeh.io import show, output_notebook
from bokeh.models import ColumnDataSource
from bokeh.palettes import Spectral6
from bokeh.plotting import figure
output_notebook()
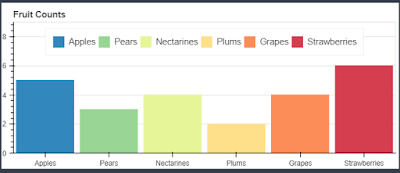
fruits = [‘Apples’, ‘Pears’, ‘Nectarines’, ‘Plums’, ‘Grapes’, ‘Strawberries’]
counts = [5, 3, 4, 2, 4, 6]
source = ColumnDataSource(data=dict(fruits=fruits, counts=counts, color=Spectral6))
p = figure(x_range=fruits, y_range=(0,9), plot_height=250, title=“Fruit Counts”,
toolbar_location=None, tools="")
p.vbar(x=‘fruits’, top=‘counts’, width=0.9, color=‘color’, legend=“fruits”, source=source)
p.xgrid.grid_line_color = None
p.legend.orientation = “horizontal”
p.legend.location = “top_center”
hide legend
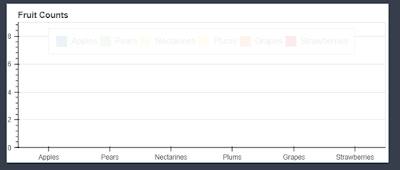
p.legend.click_policy = “hide”
show(p)
When I set the legend click policy to hide and click it, all bars are hidden, why it does not hide just the bar selected? How can I achieve it?
Thank you!

