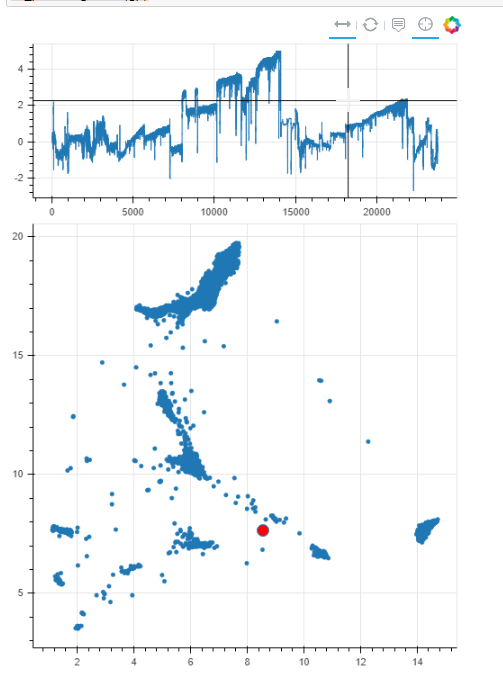
I have a bokeh gridplot and I want to connect the two subplots so that when I move the mouse on the upper plot, it will get the index of the point (based on x axis), and highlight the corresponding point in the lower plot.
How can I do that?
umap_source = ColumnDataSource(data=dict(x=umap_results[:,0], y=umap_results[:,1]))
hover_tool = HoverTool(callback=callback)

p1= figure(plot_width=500,
		   plot_height=200,
		   tools=[hover_tool,"xpan,crosshair,reset"])

p2= figure(plot_width=500,
		   plot_height=500,
		   tools="xpan,hover,reset")


p1.line(range(len(samples)), samples[:,0])

p2.scatter(umap_results[:,0],umap_results[:,1])
c2 = p2.circle(umap_results[0,0],umap_results[0,1],fill_color='red',radius=0.2)


callback = CustomJS(args=dict(s=umap_source,c2=c2), code="""
		var geometry = cb_data['geometry'];
		var x_data = geometry.x; // current mouse x position in plot coordinates
		var u0 = s['data']['x'][Math.floor(x_data)];
		var u1 = s['data']['y'][Math.floor(x_data)];
		console.log("p=>" + x_data+":"+u0+","+u1); //monitors values in Javascript console

                    // and this is what I want to do:
                    c2['x']=u0;
                    c2['y']=u1;
""")

gp = gridplot(children=[[p1], [p2]])
bk_plotting.show(gp)
I think the fundamental thing that you need to do is provide a common data source for both plots to make the consistent, simultaneous updating of the plots more straightforward.
The Boolean filter example has an interactive demonstration of floating over one plot with a hovertool and highlighting a related point in a second plot.
I checked that example, but I still didn’t understand how to use it.
In the docs example both plots share the same xaxis, so that when hovering on one plot, the x value is share, resulting the change color on the hovering.
In my case, the x axis of the top plot is the index of the dot that I want to highlight on the bottom plot. How do I make that connection?
It has nothing to do with X axis. And it’s not shared, the axes in the example are two different objects that don’t know about each other. The only thing that’s common is that source, and that’s exactly what makes the plots linked in that case.
When you inspect a point on a plot, the ColumnDataSource.inspect Bokeh signal is emitted. Every glyph renderer associated with that data source listens to that signal and re-renders itself when it’s received. And the inspected point is drawn using the hover_* visual properties that you provide to one of the glyph methods of the figure, like in this example: Styling visual attributes — Bokeh 2.4.2 Documentation
In your code, you create one data source but you don’t really use it. The code should not even work given that there’s no indexing on data sources like [:,0]. It looks like you have added the data source there just before posting the code here, without checking it. So it seems like in the working code you pass the raw data to Bokeh. This means that Bokeh will create the required instances of ColumnDataSource for you, and thus they will not know about each other, making that inspect signal not shared between plots/glyphs. For what you want to work you have to create a single data source manually and use it everywhere.
Bear in mind that what I say is only possible if the data can be represented as a single table where a row denotes a single entity and not just a random collection of columns. If you cannot put umap_results and samples in the same data source (a good sign of it is when the data have different lengths), then you will have to use some JavaScript code and some BokehJS internals to manually match indices.