Hello all,
Im trying to generate multiline chart with cycles in the points (example only with 2 lines) and let bokeh display multiple information from ColumnDataSource , but unfortuna telly Im not able to let display cycle “y Coordinates” for each line separatelly.
Bokeh version: latest
Python: 3.11
from bokeh.plotting import show, figure
from bokeh.models import DataRange1d
from bokeh.models import CrosshairTool, Span
from bokeh.models import HoverTool
from bokeh.models import ColumnDataSource
import pandas

# Defaults
Figure_sizing_mode = "stretch_width"
Figure_height=350
X_Seris_Format = "linear"
X_Series_Column = "TAH_Order"


# ToolTip
ToolTip = [
    ("Category", "@Category"),
    ("Date", "@TAH_Date{%F}"),
    ("Value", "@y{0.00}")]

ToolTip_Format = {
    "@Category": "numeral",
    "@TAH_Date": "datetime",
    "@y": "numeral"}

# Data
Value_dict = {
    "TAH_Order": [1,2,3,4,5,6,7,8,9,10],
    "TAH_Date": ["2023-06-01","2023-06-01","2023-06-02","2023-06-02","2023-06-03","2023-06-03","2023-06-04","2023-06-04","2023-06-05","2023-06-05"],
    "Category": ["CAT1","CAT1","CAT1","CAT1","CAT1","CAT1","CAT1","CAT1","CAT1","CAT1"],
    "Max_value": [44,11,29,32,29,43,49,35,29,50],
    "Min_value": [1,3,9,4,12,11,3,7,10,17]}
Value_df = pandas.DataFrame(data=Value_dict)
DataSource = ColumnDataSource(data = Value_df)

# Tools

# Hover Tool
Hover_Tool = HoverTool()
Hover_Tool.tooltips = ToolTip
Hover_Tool.muted_policy = "ignore"
Hover_Tool.formatters = ToolTip_Format
Hover_Tool.mode = "vline"

# Crosshair
Span_height = Span(dimension="height", line_dash="dashed", line_width=2, line_color="#878787")
Crosshair_Tool = CrosshairTool(overlay=Span_height)

# Chart
Chart = figure(sizing_mode = Figure_sizing_mode, height=Figure_height, toolbar_location="below", x_axis_type=X_Seris_Format)

# Chart - Lines
GS_Line_Max = Chart.line(x=Value_df["TAH_Order"], y=Value_df["Max_value"], line_width= 1, line_color = "red", line_join = "round", legend_label="Maximal", muted_alpha=0.2)
GS_Line_Min = Chart.line(x=Value_df["TAH_Order"], y=Value_df["Min_value"], line_width= 1, line_color = "green", line_join = "round", legend_label="Minimal", muted_alpha=0.2)

# Chart - Cycles --> ment to be in Hover Tool
GS_Cycles_Max = Chart.circle(source=DataSource, x=X_Series_Column, y="Max_value", size=10, fill_color = "white", line_color="red", hover_fill_color="red", legend_label="Maximal", muted_alpha=0.2)
GS_Cycles_Min = Chart.circle(source=DataSource, x=X_Series_Column, y="Min_value", size=10, fill_color = "white", line_color="green", hover_fill_color="green", legend_label="Minimal", muted_alpha=0.2)

Chart.add_tools(Hover_Tool)
Chart.add_tools(Crosshair_Tool)
Chart.hover.renderers = [GS_Cycles_Min,GS_Cycles_Max]

show(Chart)

→ always has three question marks “???”
→ at the point there shoudl be values:
for red line: “Value: 32”
for greenline: “Value: 4”
If I use column name of ColumnDataSource then in displais same value for both lines:
# ToolTip
ToolTip = [
    ("Category", "@Category"),
    ("Date", "@TAH_Date{%F}"),
    ("Value", "@Max_value{0.00}")]

ToolTip_Format = {
    "@Category": "numeral",
    "@TAH_Date": "datetime",
    "@Max_value": "numeral"}
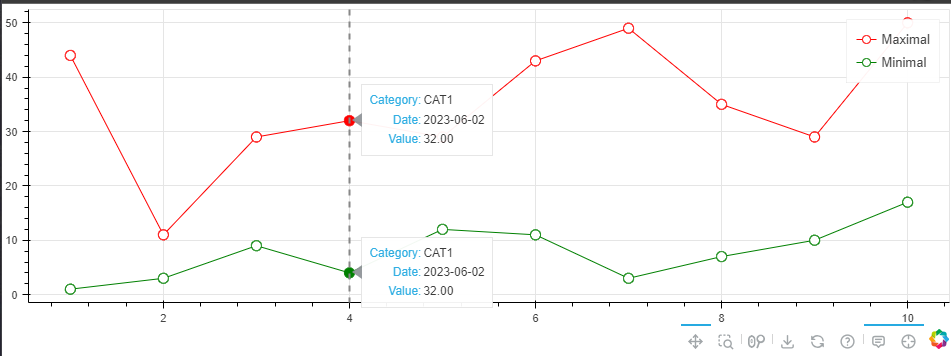
→ wrong for green line
Do you have any idea how to get it?
Need to add that this is simplest example I have also chart with 15 lines and mode depending on variables.
Thank you
Jan Vaško