For those interested, the following simple (albeit hardcoded and messy) example illustrates the interactive part of the functionality I was able to achieve, which will suit my purposes when integrated into the larger app.
The main points: (1) an on_change callback registered to the source.selected indices is used to validate and enforce constraints such that each radial slice has exactly one selected wedge which will map to a numerical weight or equalizer level in a generic case; and (2) the tags attribute is set and unset to prevent 2X recursion into the callback as the callback is listening for changes to the indices and is also manipulating those same indices.
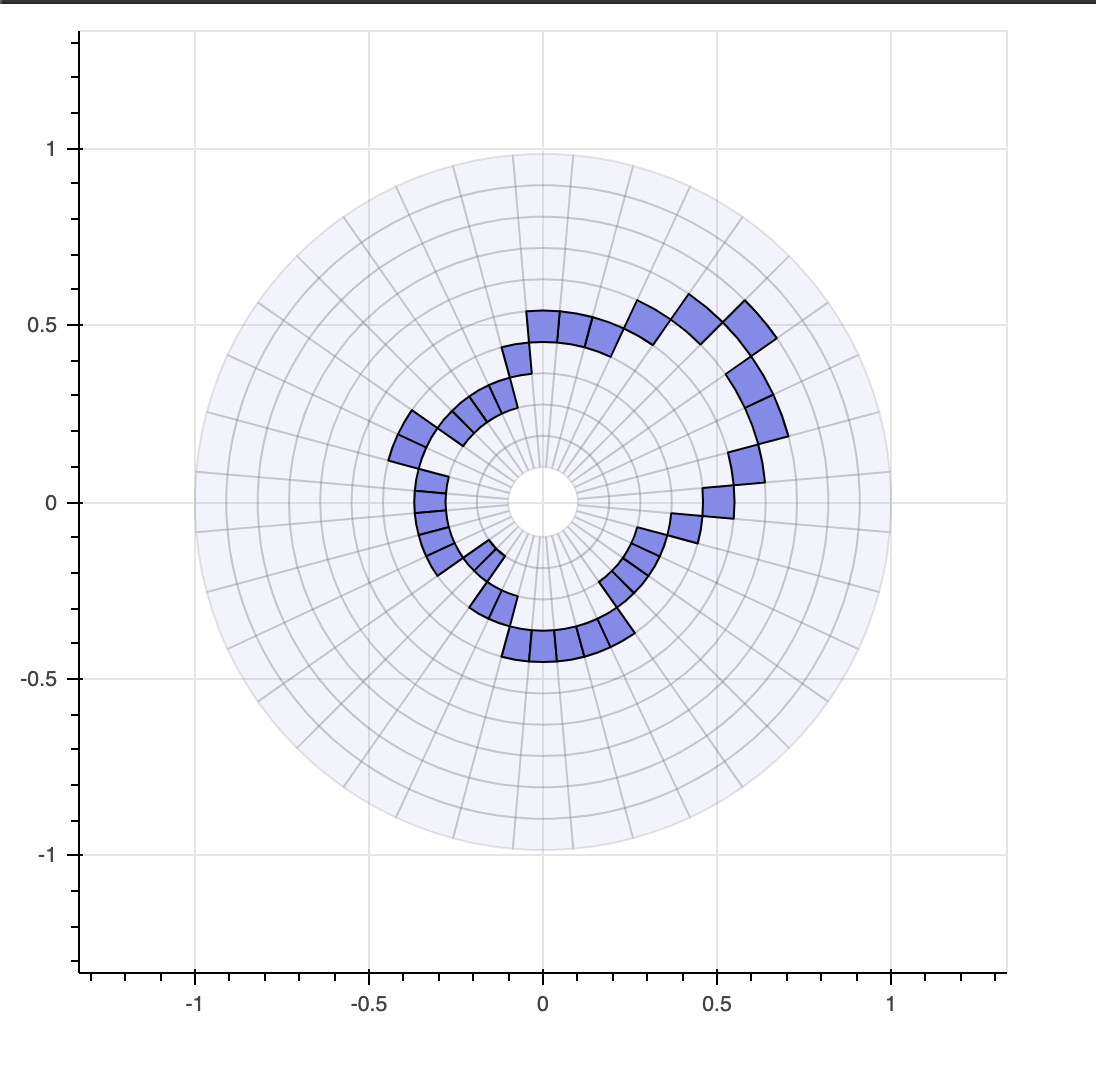
Representative Screenshot
Server Code
#!/usr/bin/env python3
# -*- coding: utf-8 -*-
"""
"""
import numpy as np
import pandas as pd

from bokeh.plotting import figure, curdoc
from bokeh.models import ColumnDataSource, TapTool

# Radial grid
num_r = 10
num_th = 36

# Inner/outer radii for annular wedges
R0 = 0.1
R1 = 1.0

dr = (R1 - R0)/num_r
dth = 2.0*np.pi/num_th

_r0 =  np.linspace(R0,R1-dr,num_r)
_th = np.linspace(0.0,2.0*np.pi-dth,num_th)

r0,th = np.meshgrid(_r0, _th)

r0 = r0.flatten()
th = th.flatten()

data = np.column_stack((r0,r0+dr,th-0.5*dth,th-1.5*dth))

df = pd.DataFrame(data=data, columns=('r0','r1','th0','th1'))

source = ColumnDataSource(data=df)
sel0 = [(c*num_r + 3) for c in range(num_th)]
source.selected.indices = sel0

def eq_cb(attr, old, new):
    if source.tags:
        source.tags = []
        return

    source.tags = ['cb']

    print("attr {:} old {:} new {:}".format(attr,old,new))
    print("")

    c = new[0] // num_r
    sel0[c] = new[0]
    source.selected.indices = sel0

source.selected.on_change('indices', eq_cb)

p = figure(x_range=(-1.333,1.333), y_range=(-1.333,1.333),
           plot_width=500, plot_height=500,
           toolbar_location=None)

eq = p.annular_wedge(x=0.0, y=0.0,
                     inner_radius="r0", outer_radius="r1",
                     start_angle="th0", end_angle="th1",
                     source=source,
                     direction='clock',
                     fill_color="#8888ee",
                     line_color="#000000")

_taptool = TapTool(renderers=[eq])
p.add_tools(_taptool)
p.toolbar.active_tap = _taptool

curdoc().add_root(p)