I am trying to fill between two lines using Bokeh. My two datasets contain sections of NaNs. The patch renders correctly for the last section of data, but fails for sections before any NaN blocks. The following example illustrates the problem:
from bokeh.plotting import figure, output_file, show
I would like the first two parallel line sections to plot with a fill-between as the final section is plotting. Instead, these sections seem to be applying the patch just to the line segments themselves. I have a solution that creates individual patches by looping over each contiguous section of data, but it is too slow over many 100s of patches.
Any solutions??
This question is also posted to Stack Overflow here.
Is there a restriction that prevents you from filtering out the nan values? Otherwise, filtering wX and wY for nan values before plotting makes the most sense.
Here’s a way that you could do so in your example and ensure that your resulting arrays aren’t mismatched in length.
···
On Tue, Jan 17, 2017 at 8:59 AM, Patrick Wright [email protected] wrote:
I am trying to fill between two lines using Bokeh. My two datasets contain sections of NaNs. The patch renders correctly for the last section of data, but fails for sections before any NaN blocks. The following example illustrates the problem:
from bokeh.plotting import figure, output_file, show
I would like the first two parallel line sections to plot with a fill-between as the final section is plotting. Instead, these sections seem to be applying the patch just to the line segments themselves. I have a solution that creates individual patches by looping over each contiguous section of data, but it is too slow over many 100s of patches.
Any solutions??
This question is also posted to Stack Overflow here.
–
You received this message because you are subscribed to the Google Groups “Bokeh Discussion - Public” group.
To unsubscribe from this group and stop receiving emails from it, send an email to [email protected].
The application of this code is for time-series data, plotting minimum and maximum air temperature with fill-between. The actual data has missing days, resulting in NaN values. I would like to keep the NaN values represented in my plot, with discontinuous segments of fill-between, showing days with measurements and days without. Therefore this solution is not applicable. Thanks!
···
On Tuesday, January 17, 2017 at 11:18:20 PM UTC-7, Tyler Nickerson wrote:
Is there a restriction that prevents you from filtering out the nan values? Otherwise, filtering wX and wY for nan values before plotting makes the most sense.
Here’s a way that you could do so in your example and ensure that your resulting arrays aren’t mismatched in length.
On Tue, Jan 17, 2017 at 8:59 AM, Patrick Wright [email protected] wrote:
I am trying to fill between two lines using Bokeh. My two datasets contain sections of NaNs. The patch renders correctly for the last section of data, but fails for sections before any NaN blocks. The following example illustrates the problem:
from bokeh.plotting import figure, output_file, show
I would like the first two parallel line sections to plot with a fill-between as the final section is plotting. Instead, these sections seem to be applying the patch just to the line segments themselves. I have a solution that creates individual patches by looping over each contiguous section of data, but it is too slow over many 100s of patches.
Any solutions??
This question is also posted to Stack Overflow here.
–
You received this message because you are subscribed to the Google Groups “Bokeh Discussion - Public” group.
To unsubscribe from this group and stop receiving emails from it, send an email to [email protected].
It looks like I wrote a response and forgot to send it… You’ve probably found a way around your problem by now but, in case it can still be of use, here’s the response I forgot to send:
I think I understand the problem better now.
You’ll see in the plotting with glyphs guide - patch glyphs section that the patch glyph can take nan values and will render multiple patches. If you examine the format of the inputs, in the example, you’ll notice that each section of points separated by nan produces a patch. Comparing it to your code, the reason you get a “full” patch at the end is because you appending your input arrays end to end. To render the desired patches using an nan based approach, you would need to find a way to do the same for each set of nan-separated values.
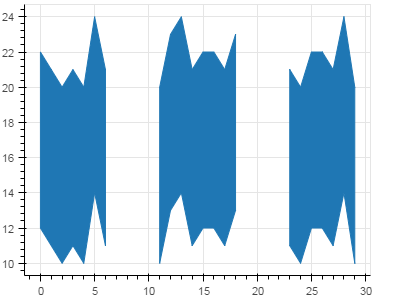
A possibly easier solution is to split your arrays up and use the patches glyph. Patches takes a list of lists containing the respective coordinate values for each patch. Here is a solution using patches along with the output plot.
from bokeh.plotting import figure, output_file, show import numpy as np import itertools
p = figure(plot_width=400, plot_height=300
) y_hi = np.array(np.random.randint(20, 25, 30), dtype=float) y_hi[7:11] = np.nan y_hi[19:23
] = np.nan y_lo = y_hi-10

x = np.arange(0.0
, len(y_hi)) x_patch = x.copy() x_patch[np.isnan(y_hi)] = np.nan def nansplit(lst):
    'splits list at nans and returns list of nested lists'
    lst = list(lst) res = [] glist = itertools.groupby(lst, lambda x: np.isnan(x)) for isnan, group in glist: if not isnan: res.append(list(group)) return res # split our x and y values
x_patch = nansplit(x_patch) y_patch_hi = nansplit(y_hi) y_patch_lo = nansplit(y_lo) # append each set of values to create "full" patches
x_patch = [x + x[::-1] for x in x_patch] y_patch = [y_patch_hi[i] + y_patch_lo[i][::-1                ] for i in range(len(y_patch_hi))] p.patches(xs = x_patch, ys = y_patch) output_file('test.html'
) show(p)
···
On Thu, Jan 19, 2017 at 1:49 PM, Patrick Wright [email protected] wrote:
The application of this code is for time-series data, plotting minimum and maximum air temperature with fill-between. The actual data has missing days, resulting in NaN values. I would like to keep the NaN values represented in my plot, with discontinuous segments of fill-between, showing days with measurements and days without. Therefore this solution is not applicable. Thanks!
On Tuesday, January 17, 2017 at 11:18:20 PM UTC-7, Tyler Nickerson wrote:
Is there a restriction that prevents you from filtering out the nan values? Otherwise, filtering wX and wY for nan values before plotting makes the most sense.
Here’s a way that you could do so in your example and ensure that your resulting arrays aren’t mismatched in length.
On Tue, Jan 17, 2017 at 8:59 AM, Patrick Wright [email protected] wrote:
I am trying to fill between two lines using Bokeh. My two datasets contain sections of NaNs. The patch renders correctly for the last section of data, but fails for sections before any NaN blocks. The following example illustrates the problem:
from bokeh.plotting import figure, output_file, show
I would like the first two parallel line sections to plot with a fill-between as the final section is plotting. Instead, these sections seem to be applying the patch just to the line segments themselves. I have a solution that creates individual patches by looping over each contiguous section of data, but it is too slow over many 100s of patches.
Any solutions??
This question is also posted to Stack Overflow here.
–
You received this message because you are subscribed to the Google Groups “Bokeh Discussion - Public” group.
To unsubscribe from this group and stop receiving emails from it, send an email to [email protected].
This looks awesome, thanks! I actually have not found a solution as of yet… I will try this out on my larger dataset and see what sort of speed/efficiency I get with your method… right now, I am kind of limited by processing time as this is intended for web presentation in an app and I am running into load-time issues. I’ll try it out and get back to you. Thanks!
···
On Tuesday, January 17, 2017 at 9:59:44 AM UTC-7, Patrick Wright wrote:
I am trying to fill between two lines using Bokeh. My two datasets contain sections of NaNs. The patch renders correctly for the last section of data, but fails for sections before any NaN blocks. The following example illustrates the problem:
from bokeh.plotting import figure, output_file, show
I would like the first two parallel line sections to plot with a fill-between as the final section is plotting. Instead, these sections seem to be applying the patch just to the line segments themselves. I have a solution that creates individual patches by looping over each contiguous section of data, but it is too slow over many 100s of patches.
Any solutions??
This question is also posted to Stack Overflow here.