Dear Bokeh group,
I currently have a figure created with the following code:
p = figure(plot_width = 1200, plot_height = 500,
x_axis_type = “datetime”, x_axis_label = “Date”,
y_axis_label = self._var_dict.get(self.y_name),
toolbar_location = “above”, tools = tool_l,
y_range = Range1d(yrange_min, yrange_max))
#create line plots
l1 = p.line(“date”, “y”, source = source, color = “blue”,
legend = self._var_dict.get(self.y_name) + " (data)")
c1 = p.circle(“date”, “y”, source = source, color = “blue”,
size = 2,
legend = self._var_dict.get(self.y_name) + " (data)")
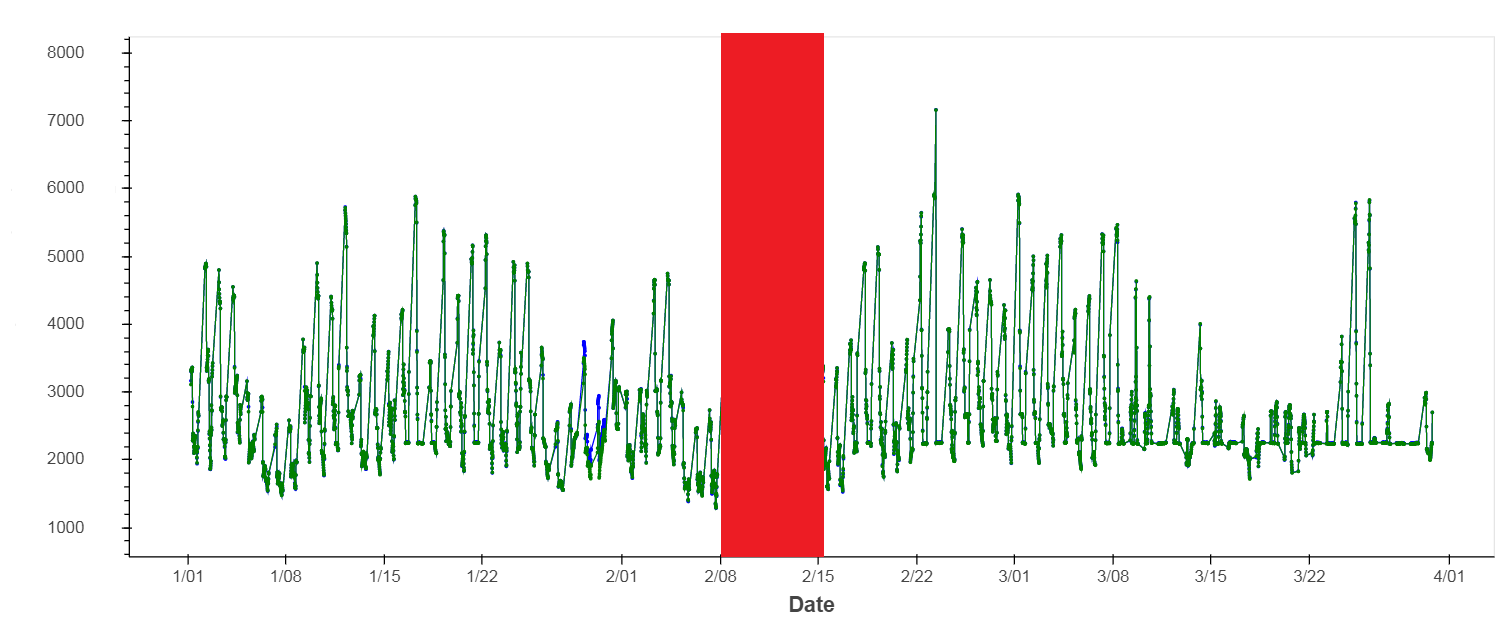
However I would like to add a patch on top of it, I understand the example on documentation: p.patch([1, 2, 3, 4, 5], [6, 7, 8, 7, 3], alpha=0.5, line_width=2), but how does it work with an x aixs with type “datetime”?
Thanks!