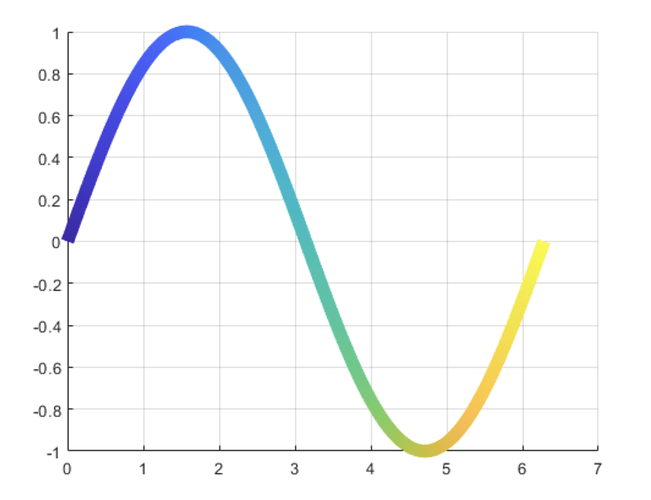
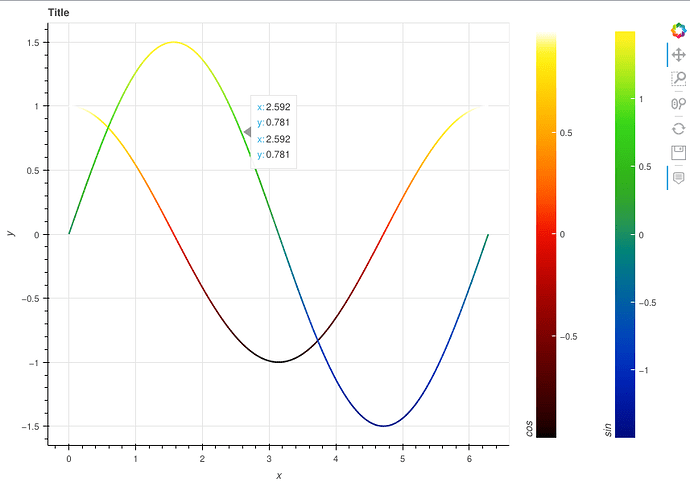
With Bokeh we can create a color mapper, mapping an attribute to a color, and apply it to scatter plots. Is it possible to do something similar to line plots in order to achieve gradient coloring for a single line based on some attribute?
Yes. You will need to use either a Segment or MultiLine glyph; the Line glyph only supports a single color.
However, using those will produce individual straight line segments without proper joins where the segments meet. If you are after a “smooth and continuous” color mapping along a curved line, rather than discrete sub-segments, then Bokeh is probably not the right tool for your use case.
Perhaps I’ve misunderstood the question. I was under the impression that the scenario here is …
one has an N-point sequence of data. It is possible to use a transform on that data so that the same source can be used to represent the N-1 point segments.
It’s possible, and if so the solutions you mentioned will work (modulo the line joining issues). But folks have also asked for this on occasion, and it was not clear to me which was the case here:
Thanks for the answers! I tried the MultiLine approach and I have a few questions.
from bokeh.plotting import figure, show
from bokeh.io import output_notebook
from bokeh.io import curdoc
from bokeh.models import LinearColorMapper, ColumnDataSource, MultiLine, ColorBar
import numpy as np
import colorcet

output_notebook(hide_banner=True)

fig = figure(
    title = "Title",
    x_axis_label = "x",
    y_axis_label = "y",
    sizing_mode = "stretch_width",
    tools = "pan,wheel_zoom,box_zoom,reset,hover,save",
    tooltips = [
        ("x", "$x"),
        ("y", "$y")
    ]
)

def create_renderers(x, y, colormap, name):
    xs = [x[i-1:i+1] for i in range(1, len(x))]
    ys = [y[i-1:i+1] for i in range(1, len(y))]
    l = [np.mean(t) for t in ys]

    color_mapper = LinearColorMapper(palette=colormap,
        low=min(l), high=max(l))
    data_source = ColumnDataSource(dict(
        xs = [x[i-1:i+1] for i in range(1, len(x))],
        ys = [y[i-1:i+1] for i in range(1, len(y))],
        l = l))

    glyph = MultiLine(xs="xs", ys="ys",
                      line_color={'field': 'l', 'transform': color_mapper},
                      line_width=2, name=name)

    color_bar = ColorBar(color_mapper=color_mapper, title=name)
    return data_source, glyph, color_bar

x1 = np.linspace(0, 2 * np.pi, 300)
y1 = np.cos(x1)
y2 = 1.5 * np.sin(x1)
ds1, line1, cb1 = create_renderers(x1, y1, colorcet.fire, "cos")
ds2, line2, cb2 = create_renderers(x1, y2, colorcet.bgy, "sin")
fig.add_glyph(ds1, line1)
fig.add_layout(cb1, 'right')
fig.add_glyph(ds2, line2)
fig.add_layout(cb2, 'right')

if len(fig.legend) > 0:
    fig.legend.visible = True
    fig.add_layout(fig.legend[0], 'right')

show(fig)
When I have a lot of segments, the tooltip is showing multiple data points. Is it possible to only show the first data point?
In the tooltip, is it possible to show the value of the attribute associated to the color in that datapoint?
Is the attribute name of the MultiLine object rendered somewhere?
@Bryan I’m not familiar at all with the javascript side of Bokeh, so correct me if I’m wrong. Bokeh currently doesn’t support smooth color mapping along a curve (above we used a discretized approach, where each segment gets a different color). Is that a feature (smooth coloring) that would be possible to implement? I know that Bokeh supports at least two output backends (webgl and svg). I think it would be possible to implement it in the webgl backend, whereas it should be quite difficult to implement it for svg?!?!? Does it make sense to implement one feature that works only for one backend?
There’s almost no chance we would do this. Apart from this sort of situation always ending up being a confusing pain point for users, it’s also just not anything that is ever had high demand. I think the is the second or third time I’ve seen an ask for it in ten years. Speaking plainly, the cost/benefit ratio is simply not justified to add that complexity.
When I have a lot of segments, the tooltip is showing multiple data points. Is it possible to only show the first data point?
No, this is still an open issue: Provide hit_filter property on HoverTool and TapTool · Issue #9087 · bokeh/bokeh · GitHub
In the tooltip, is it possible to show the value of the attribute associated to the color in that datapoint?
Yes, you can add a color swatch to the tooltip
Is the attribute
nameof the MultiLine object rendered somewhere?
Only if you ask for it in your tooltip specification or template.
Information about both those questions is in the docs: https://docs.bokeh.org/en/latest/docs/user_guide/tools.html#hovertool

