I am trying to replicate the graph I attached (done with Matplotlib) where the background colours on the graph represent some genomic coordinates. My data is set in a pandas DataFrame and I have two columns in the DF to indicate grouping/boundaries between all regions. I have many genes to plot, and all of them have a completely different pattern.
So all tagged with 1411 will have a green background, all tagged with 1412 will have a green background and 1413 will be green, and so on. I understand the BoxAnnotation might be the best option here, but I am failing to convert the columns I have into something meaningful that will cover many different patterns.
On Wednesday, 21 November 2018 09:06:48 UTC-7, Paulo Nuin wrote:
Hi everyone
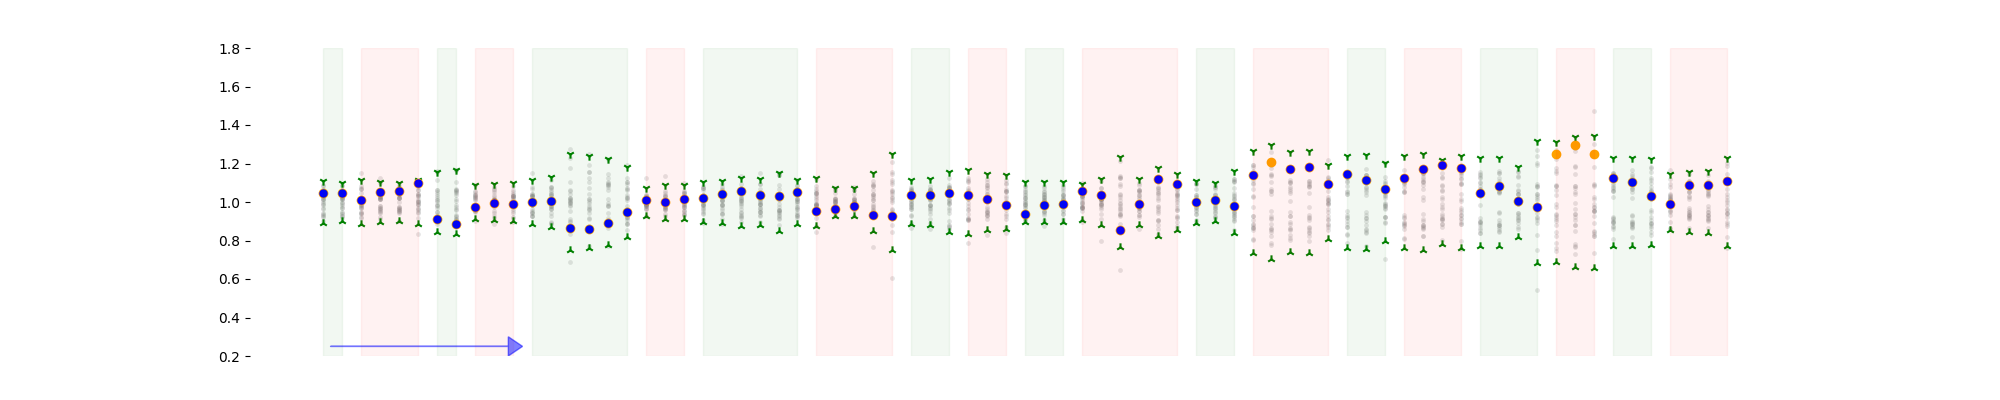
I am trying to replicate the graph I attached (done with Matplotlib) where the background colours on the graph represent some genomic coordinates. My data is set in a pandas DataFrame and I have two columns in the DF to indicate grouping/boundaries between all regions. I have many genes to plot, and all of them have a completely different pattern.
So all tagged with 1411 will have a green background, all tagged with 1412 will have a green background and 1413 will be green, and so on. I understand the BoxAnnotation might be the best option here, but I am failing to convert the columns I have into something meaningful that will cover many different patterns.
I am glad to hear that you were able to find a solution. It would be appreciated if you could share at least a summary of what you found out, for the benefit of other users who may come across this question.
On Wednesday, 21 November 2018 09:06:48 UTC-7, Paulo Nuin wrote:
Hi everyone
I am trying to replicate the graph I attached (done with Matplotlib) where the background colours on the graph represent some genomic coordinates. My data is set in a pandas DataFrame and I have two columns in the DF to indicate grouping/boundaries between all regions. I have many genes to plot, and all of them have a completely different pattern.
So all tagged with 1411 will have a green background, all tagged with 1412 will have a green background and 1413 will be green, and so on. I understand the BoxAnnotation might be the best option here, but I am failing to convert the columns I have into something meaningful that will cover many different patterns.
Thanks, this was my first reply from this list. I think it’s quite useful to post a solution to some problem, especially for other people with similar issues.
In my case it was quite simple, I got the column from the pandas DataFrame and iterate over it to add to a list to the BoxAnnotation.
Simple.
Thanks
Paulo
···
On Monday, 26 November 2018 15:56:53 UTC-7, Bryan Van de ven wrote:
Hi Paulo,
I am glad to hear that you were able to find a solution. It would be appreciated if you could share at least a summary of what you found out, for the benefit of other users who may come across this question.
On Wednesday, 21 November 2018 09:06:48 UTC-7, Paulo Nuin wrote:
Hi everyone
I am trying to replicate the graph I attached (done with Matplotlib) where the background colours on the graph represent some genomic coordinates. My data is set in a pandas DataFrame and I have two columns in the DF to indicate grouping/boundaries between all regions. I have many genes to plot, and all of them have a completely different pattern.
The columns look like these
chr7:EZH2:1411 chr7:EZH2:1411_148504773_148504823
chr7:EZH2:1412 chr7:EZH2:1412_148506148_148506198
chr7:EZH2:1412 chr7:EZH2:1412_148506198_148506248
chr7:EZH2:1412 chr7:EZH2:1412_148506248_148506298
chr7:EZH2:1413 chr7:EZH2:1413_148506387_148506437
chr7:EZH2:1413 chr7:EZH2:1413_148506437_148506487
chr7:EZH2:1413 chr7:EZH2:1413_148506487_148506537
chr7:EZH2:1414 chr7:EZH2:1414_148507410_148507460
chr7:EZH2:1414 chr7:EZH2:1414_148507460_148507510
chr7:EZH2:1414 chr7:EZH2:1414_148507510_148507560
chr7:EZH2:1415 chr7:EZH2:1415_148508702_148508752
chr7:EZH2:1415 chr7:EZH2:1415_148508752_148508802
chr7:EZH2:1415 chr7:EZH2:1415_148508802_148508852
chr7:EZH2:1416 chr7:EZH2:1416_148511036_148511086
chr7:EZH2:1416 chr7:EZH2:1416_148511086_148511136
chr7:EZH2:1416 chr7:EZH2:1416_148511136_148511186
chr7:EZH2:1416 chr7:EZH2:1416_148511186_148511236
chr7:EZH2:1416 chr7:EZH2:1416_148511236_148511286
So all tagged with 1411 will have a green background, all tagged with 1412 will have a green background and 1413 will be green, and so on. I understand the BoxAnnotation might be the best option here, but I am failing to convert the columns I have into something meaningful that will cover many different patterns.
Thanks in advance, any help appreciated.
Cheers
Paulo
–
You received this message because you are subscribed to the Google Groups “Bokeh Discussion - Public” group.
To unsubscribe from this group and stop receiving emails from it, send an email to [email protected].