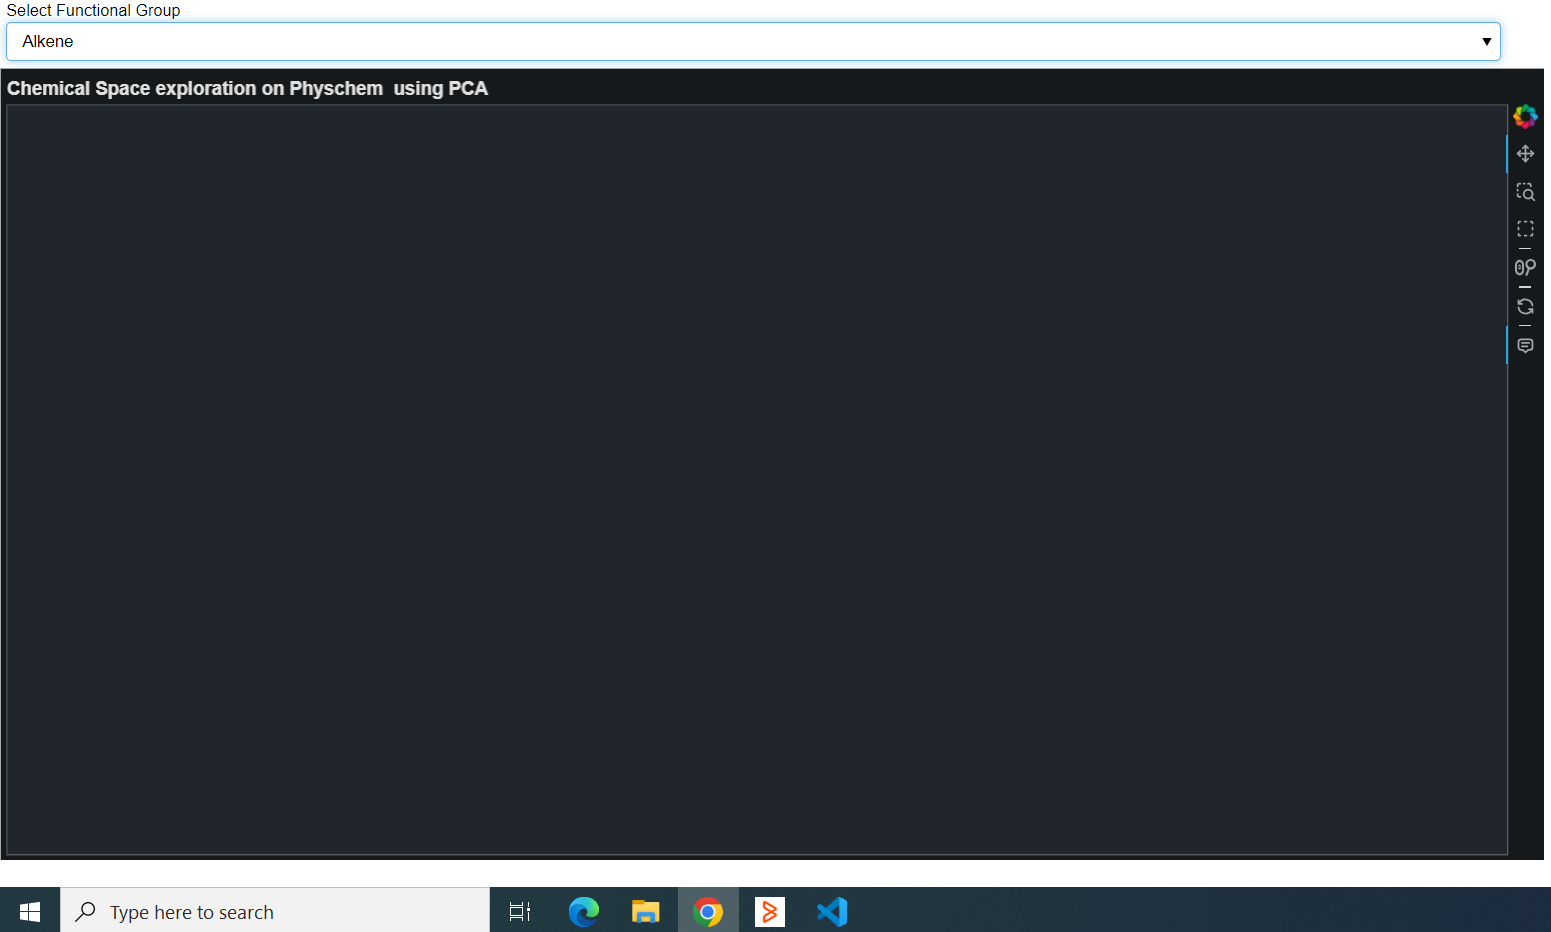
I am trying to filter data using filter where a dropdown box is used to select an option. The plot is showing fine for fist time but after second selection the plot becomes blank.
Bokeh version 3.2. 2
It is impossible to even begin to speculate without more information such as all relevant package versions and a complete Minimal Reproducible Example.
I am trying to filter data using filter where a dropdown box is used to select an option. The plot is showing fine for fist time but after second selection the plot becomes blank.
The code is running fine with show(layout)
It also works fine for first selection.
After making the next selection the plot goes blank.
I think I am making a mistake in this part of the code:
functional_group_select = Select(title="Select Functional Group", options=["All"] + list(data_viz['Functional_Groups'].unique()), value="All")
callback = CustomJS(args=dict(source=datasource, select=functional_group_select), code="""
    var data = source.data;
    var selected_group = select.value;
    var x = data['x'];
    var y = data['y'];
    var image = data['image'];
    var functional_groups = data['Functional_Groups'];
    var hazardous = data['Hazardous'];

    // Create new arrays to store filtered data
    var new_x = [];
    var new_y = [];
    var new_image = [];
    var new_functional_groups = [];
    var new_hazardous = [];

    // Iterate through the data and filter based on the selected group
    for (var i = 0; i < x.length; i++) {
        if (selected_group === "All" || functional_groups[i] === selected_group) {
            new_x.push(x[i]);
            new_y.push(y[i]);
            new_image.push(image[i])
            new_functional_groups.push(functional_groups[i]);
            new_hazardous.push(hazardous[i]);
        }
    }

    // Update the data source with filtered data
    source.data['x'] = new_x;
    source.data['y'] = new_y;
    source.data['image'] = new_image
    source.data['Functional_Groups'] = new_functional_groups;
    source.data['Hazardous'] = new_hazardous;
    source.change.emit();
""")
functional_group_select.js_on_change('value', callback)
@Ravi_Singh The code looks plausible at a glance, I can’t say anything more without have complete code I can actually copy and paste into an editor and run, to reproduce what you are seeing. Otherwise, the usual generic suggestion is to add console.log statements and then checking the brower’s JS console to do your own “printf debugging”.
Thanks @Bryan. Please accept my sincere apologies.
!pip install gdown
!gdown --id 1xzE40RiB4pWclw3hBuS_RNtoCGGVuCL1    #This will download my csv file
data_viz=pd.read_csv('data.csv')

from bokeh.plotting import figure, show, reset_output, output_notebook,curdoc, output_file
from bokeh.models import HoverTool, ColumnDataSource, CategoricalColorMapper, Dropdown, CustomJS, Div,CDSView,BooleanFilter
from bokeh.models.tools import BoxSelectTool

from bokeh.io import curdoc
from bokeh.themes import Theme
#from bokeh.themes import dark_minimal_theme
from bokeh.models import CustomJS, ColumnDataSource, Select, Div, BooleanFilter, CDSView
from bokeh.plotting import figure, show
from bokeh.layouts import column
from bokeh.io import curdoc, output_file
from bokeh.palettes import Spectral10,Set1,Accent,Pastel1
from bokeh.transform import factor_cmap, factor_mark
from bokeh.models import Select, CustomJS
from bokeh.layouts import column


def create_plot():
    plot_figure = figure(
        title='Chemical Space exploration on FG  using tSNE',
        frame_width=1200,
        frame_height=600,
        tools=('pan, box_zoom, wheel_zoom, reset',BoxSelectTool(dimensions="both"))
    )


    # Add HoverTool with updated tooltip
    hover = HoverTool(tooltips="""
    <div>
        <div>
            <img src='@image' style='float: left; margin: 5px 5px 5px 5px'/>
        </div>
        <div>
            <span style='font-size: 16px; color: #224499'>CAS No:</span>
            <span style='font-size: 18px'>@CAS_No</span>
        </div>
        <div>
            <span style='font-size: 16px; color: #224499'>Functional Groups:</span>
            <span style='font-size: 18px'>@Functional_Groups</span>
        </div>
    </div>
    """)
    plot_figure.add_tools(hover)
    plot_figure.circle('x', 'y', source=datasource, legend_field='Hazardous',
                       size=6, color=factor_cmap('Hazardous', 'Set1_3', [ 'Hazardous','Non-hazardous']),view=view)


    return plot_figure


datasource = ColumnDataSource(data=data_viz)

# Create a BooleanFilter to handle the selection
bools = [True] * len(datasource.data['x'])  # Initialize with all True
view = CDSView(filter=BooleanFilter(bools))
plot = create_plot()
# Define a Div for selected images
selected_images_div = Div(text="", width=400)
# Define a JavaScript callback to update the selected images in the Div
selected_images_callback = CustomJS(args=dict(source=datasource, div=selected_images_div), code="""
    var selected_indices = source.selected.indices;
    var selected_images = [];
    for (var i = 0; i < selected_indices.length; i++) {
        var imageSrc = source.data.image[selected_indices[i]];
        var CasNo = source.data.CAS_No[selected_indices[i]];
        selected_images.push('<div style="display: flex; align-items: center; margin: 5px;"><img src="' + imageSrc + '" style="width: 100px; margin-right: 10px;" /><div>' + CasNo + '</div></div>');
    }
    div.text = selected_images.join('');
""")

# Attach the callback to the data source
datasource.selected.js_on_change('indices', selected_images_callback)


# Create a Select widget
functional_group_select = Select(title="Select Functional Group", options=["All"] + list(data_viz['Functional_Groups'].unique()), value="All")

callback = CustomJS(args=dict(source=datasource, select=functional_group_select, boolean_filter=bools), code="""
    var selected_group = select.value;
    var data = source.data;
    var indices = source.selected.indices;

    // Reset the BooleanFilter to select all points
    for (var i = 0; i < boolean_filter.length; i++) {
        boolean_filter[i] = true;
    }

    // Update the BooleanFilter based on the selected group
    if (selected_group !== "All") {
        for (var i = 0; i < data['x'].length; i++) {
            if (data['Functional_Groups'][i] !== selected_group) {
                boolean_filter[i] = false;
            }
        }
    }

    // Update the view
    //view.filters.change.emit();
""")

functional_group_select.js_on_change('value', callback)


# Create a CDSView using the BooleanFilter

# Create the plot
  # Pass the view to the plot

layout = column(functional_group_select, plot, selected_images_div)
curdoc().theme = 'dark_minimal'

# Specify the path to save the HTML file
#output_file('your_plot.html')

# Show the layout and save to the HTML file
show(layout)
The issue is the plots are not updating after selection.
@Ravi_Singh your code creates a CDSView but then does not actually use it anywhere for anything, and then your callback is also a no-op since it updates a passed-in list but does not actually change the state of any Bokeh model object (which is what would trigger updates and redraws).
I’m out of bandwidth at the moment but assuming you actually add the view to something, then the callback code should probably look more like
callback = CustomJS(args=dict(source=datasource, select=functional_group_select, view=view), code="""
    const selected_group = select.value;
    const booleans = new Array(view.filter.booleans.length).fill(true)

    if (selected_group !== "All") {
        for (var i = 0; i < source.data.x.length; i++) {
            if (source.data['Functional_Groups'][i] !== selected_group) {
                booleans[i] = false;
            }
        }
    }

    view.filter.booleans = booleans
""")
A closer look will have to wait until later. FYI it would also be appreciated if the code is updated to satisfy the Minimal aspect of “Minimal Reproducible Example”. There is currently a huge amount of irrelevant cruft in this, unused imports, unrelated visual styling, other interactions that have nothing to do with the issue at hand. All of that gets in the way of helping as quickly as possible.
1 Like
@Bryan Thank you for your time. I tried what you said but I think am making a mistake somewhere.
Here is the simplified version of code
from bokeh.plotting import figure, show
from bokeh.models import ColumnDataSource, CDSView, BooleanFilter, Select, CustomJS
from bokeh.layouts import column

data = {
    "x": [10.5913925, 6.7851043, 10.4453535, 4.118456, 9.844685],
    "y": [9.87213, 5.7875376, 8.286762, 10.943747, 6.190272],
    "Functional_Groups": [
        "Alcohol, Carboxylic_acid",
        "Dialkylether, Acetal, Acetal_like, Aromatic, Heterocyclic",
        "Primary_aliph_amine, Alkylthiol, Carboxylic_acid",
        "Organometallic_compounds",
        "Phenol, Arylchloride, Aromatic",
    ],
}

datasource = ColumnDataSource(data=data)
bools = [True] * 5

plot_figure = figure(
    title='Exploration',
    frame_width=900,
    frame_height=600,
    tools=('pan, box_zoom, wheel_zoom, reset'))
view = CDSView(filter=BooleanFilter(bools))
plot_figure.circle('x', 'y', source=datasource, size=10, view=view)

functional_group_select = Select(title="Select Functional Group", options=["All"] + data["Functional_Groups"], value="All")

callback = CustomJS(args=dict(source=datasource, select=functional_group_select, view=view), code="""
    const selected_group = select.value;
    const booleans = new Array(view.filter.booleans.length).fill(true);
    // Update the BooleanFilter based on the selected group
    if (selected_group !== "All") {
        for (var i = 0; i < source.data.x.length; i++) {
            if (source.data.Functional_Groups[i] !== selected_group) {
                booleans[i] = false;
            }
        }
    }
    view.filter.booleans = booleans;

""")
functional_group_select.js_on_change('value', callback)

layout = column(functional_group_select, plot_figure)
show(layout)
Hey @Ravi_Singh ,
I was looking at your minimal example. I think the issue can be solved by including source.change.emit(); at the last line of your JS callback.
Thanks.
1 Like
Yes, adding a source.chagne.emit() will force a re-render with a re-evaluation of the filter. Ideally just setting a new value for filter.booleans would also automatically trigger that as well, but I suppose there is some internal plumbing that would need to be hooked up. Might be worth a GitHub Issue with full details,
Thanks @Chaitanya @Bryan . It worked.
1 Like
This topic was automatically closed 90 days after the last reply. New replies are no longer allowed.