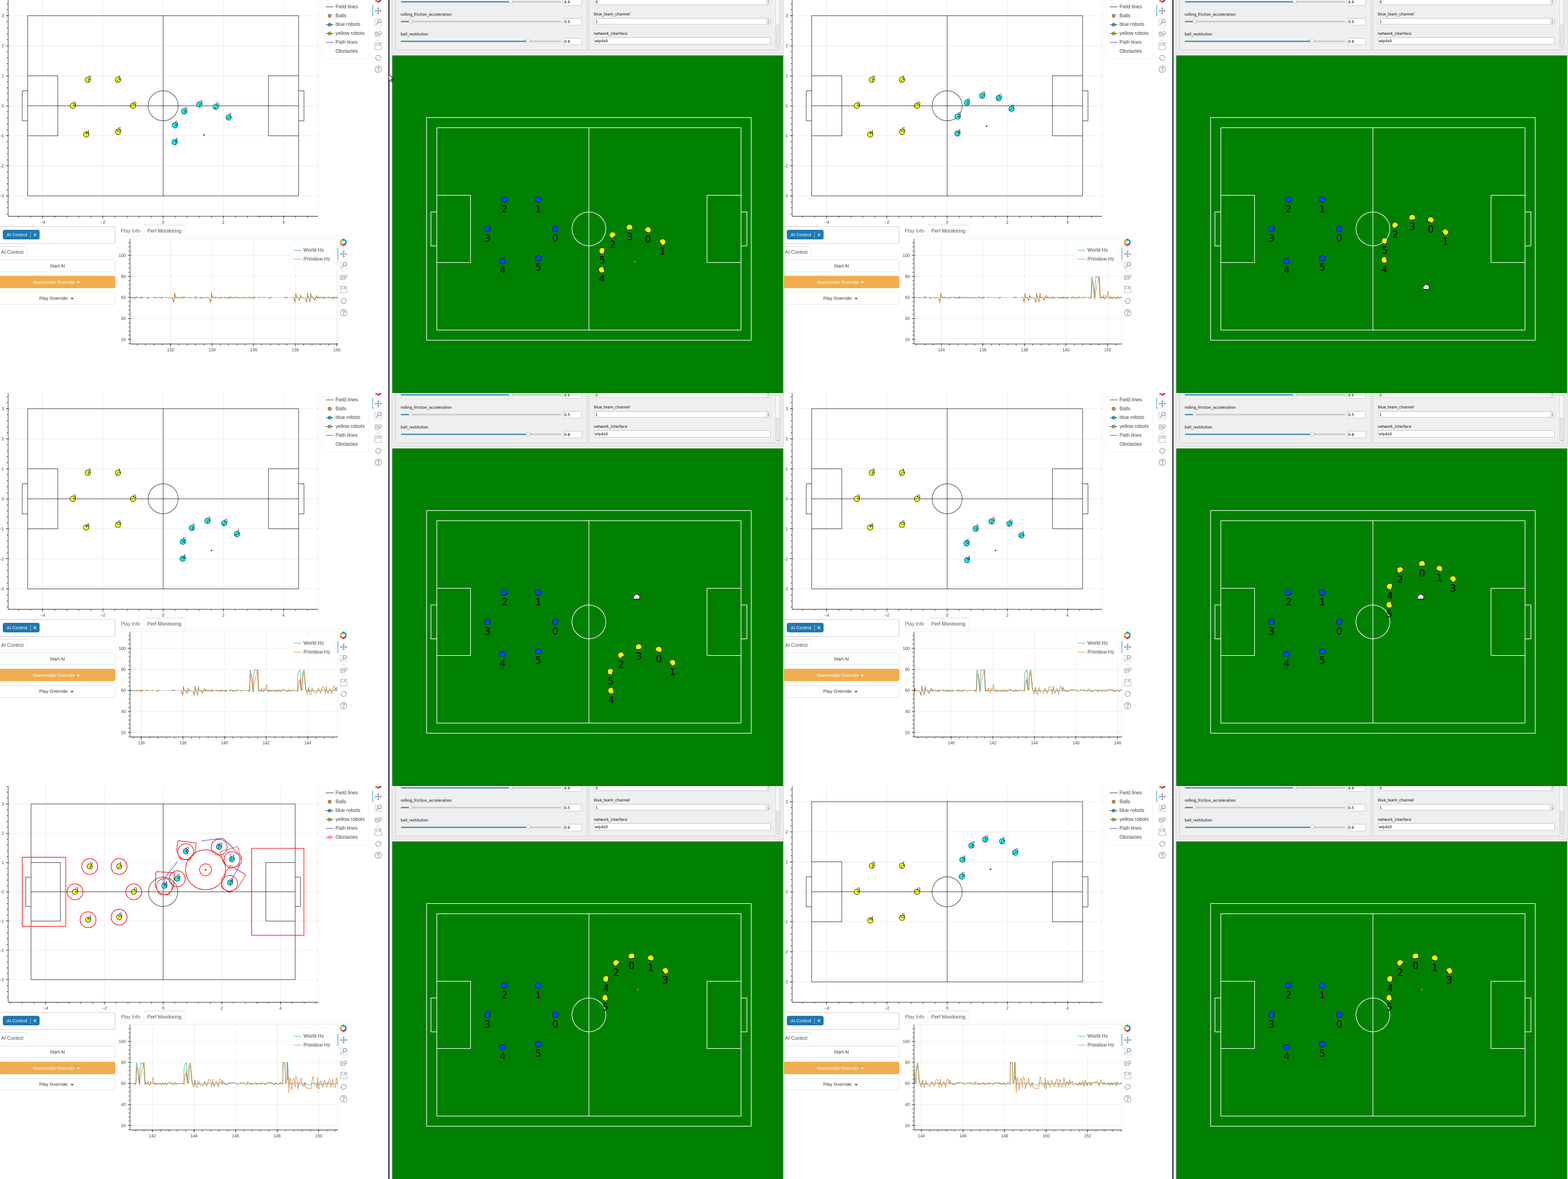
Hello!
I am working on a visualization system for an engineering student team that works on autonomous soccer-playing robots.
We have a simulator (green window to the right, that generates “World” data (positions of robots, ball)) which then goes through our “AI”. Our AI coordinates the robots and sends commands to the robots to move and do stuff. We currently visualize the output of our AI with QT but are finding it limiting.
This is where we are experimenting with bokeh.
We would like bokeh to visualize in “real time” (around 60hz ideally) the planned paths (blue multi line in GIF), the navigation obstacles on the field (red multi line in GIF), the field lines, all the positions of the robots and the ball (blue, yellow circles are robots).

Our AI is written in C++ and it streams protobufs over unix sockets with data to visualize. We have a bokeh server running that receives the protobuf and uses ColumnDataSources to update the plots. We have different threads receiving the protobufs which call the add_next_tick_callback to schedule the update functions with the newly received protobuf.
Obstacle Plotting Code Here (Red Multiline)
I cant post more than 2 links, but in the same folder there is a plot_path.py that plots the blue multiline shown above.
File that starts the bokeh server and registers callbacks here
We are noticing that as we add more plots, the visualization output starts to get buffered and falls behind. You can see in the gif that every time we move the ball (the robots follow in a circular formation), the response is delayed (but fully buffered so it eventually displays it). If we only plot the obstacles or only plot the robots, then it is pretty much real time.
(side note: It actually got worse capturing a GIF of the bokeh plot running in google chrome with peek (gif recorder) on ubuntu 20. When I close peek, the plot picks up again and is noticeably faster)
- Is bokeh the right tool for our usecase? (i.e Is this too many layers, too many plots, too fast?)
- Is the example code above not the correct way to update the data in a plot as we receive it?
- Is there a way to know how long it takes for a bokeh plot to tick? It would help us to know if bokeh is falling behind “real time” and buffering the output.
- Any other debugging advice?
I am on Ubuntu 20.04, using Bokeh 2.4.2. Happy to provide more infromation
Any help would be greatly appreciated, thank you!