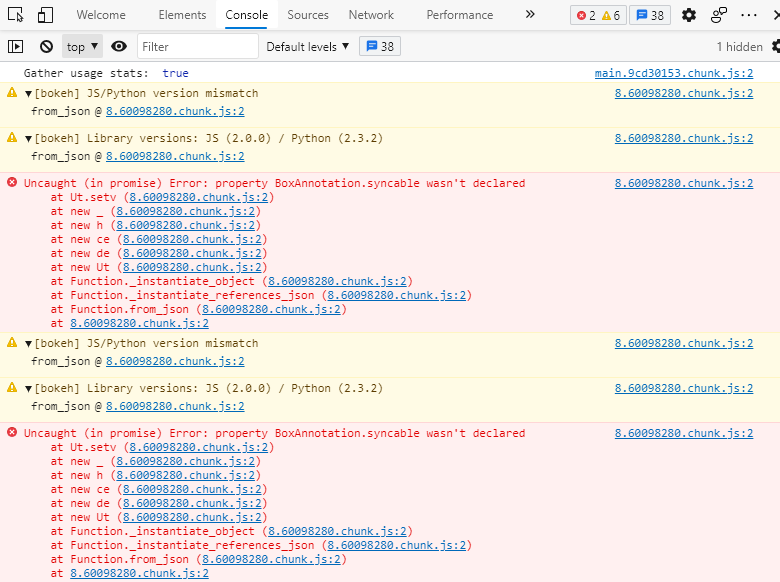
Hi everyone, hopefully someone can help me solve this problem:
I’ve designed a series of plots using Bokeh that I am embedding into a streamlit app that is run in a docker container on an MS Azure server. I initially developed the plots locally and they rendered as expected. I then used docker to create a container that I pushed to my Azure account and deployed a web app in the normal manner. When I access the app through the internet the plots that were rendered fine locally were no longer rendered in any form. The website appears to skip to the next line when the different display methods are called. I’ve repeated this in Edge browser on my MS work machine and Safari on my personal Macbook with neither rendering the figures as expected.
I prepared a very simple version of the app at https://hw3-11(dot)azurewebsites(dot)net that uses Bokeh to access the autompg data set and then plot some figures and then plots them using the bokeh.plotting figure. (I’ll leave the page up for a few days from 30 June 2021 before removing it) I ‘think’ being able to call the data set shows that bokeh is running correctly, though I’m not sure. I also double checked that it wasn’t a rendering option by using matplotlib to plot some random numbers and that it wasn’t numpy by using that to generate some arrays and plot some other things in matplotlib.
I’m using a docker file that a colleague of mine created for this purpose. I’m a scientist rather than an azure / docker engineer, and I’ve assumed that everything here is as it should be.
The docker file reads (unaligned):
**** BEGIN DOCKERFILE ****
FROM python:3.7-slim-buster
ENV DEBIAN_FRONTEND noninteractive
RUN apt-get update && \
apt-get -y install gcc mono-cs && \
rm -rf /var/lib/apt/lists/*
COPY /app /app
WORKDIR /app
RUN pip install -r requirements.txt
EXPOSE 8501
RUN mkdir -p ~/.streamlit
WORKDIR /app
ENTRYPOINT ["streamlit", "run"]
CMD["hw3.py"]
**** END DOCKERFILE ****
Requirements are as follows:
**** BEGIN requirements.txt ****
streamlit
bokeh
numpy
matplotlib
**** END requirements.txt ****
This is a pretty bare bones example however I figured that a minimalist approach would show the errors more clearly.
I tried calling the plot using the bokeh_chart and the write methods to double check if there was a preferred method. Without writing out the entire python code, the calls to the bokeh figures are:
import streamlit as st
from bokeh.sampledata.autompg import autompg_clean as df_bk
from bokeh.plotting import figure

p = figure(title = 'Test Bokeh Plot')
p.scatter(x = 'displ', y = 'hp', source = df_bk)
st.bokeh_chart(p)
st.write(p)
I won’t include the code for the matplotlib or numpy elements as they work as expected.
Thanks for your help!

