I am following this example to plot training cost:
http://blocks.readthedocs.org/en/latest/plotting.html
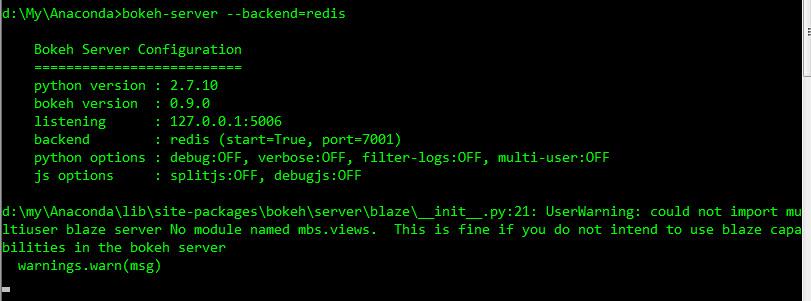
Below is my code environments (see attached):
bokeh 0.9.0
Anaconda 2.3.0 (64-bit)
IPython 3.2.0
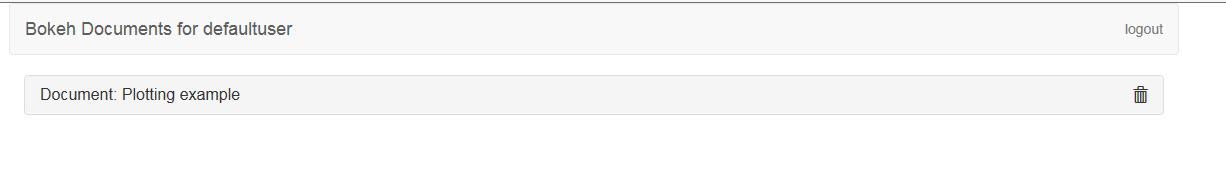
After the example is run, I go to http://localhost:5006, and click “Plotting example” (see attached), but no graphics are displayed.
Any guidance is appreciated!
Rick