Bokeh server app: Unable to update the image

Hi there,

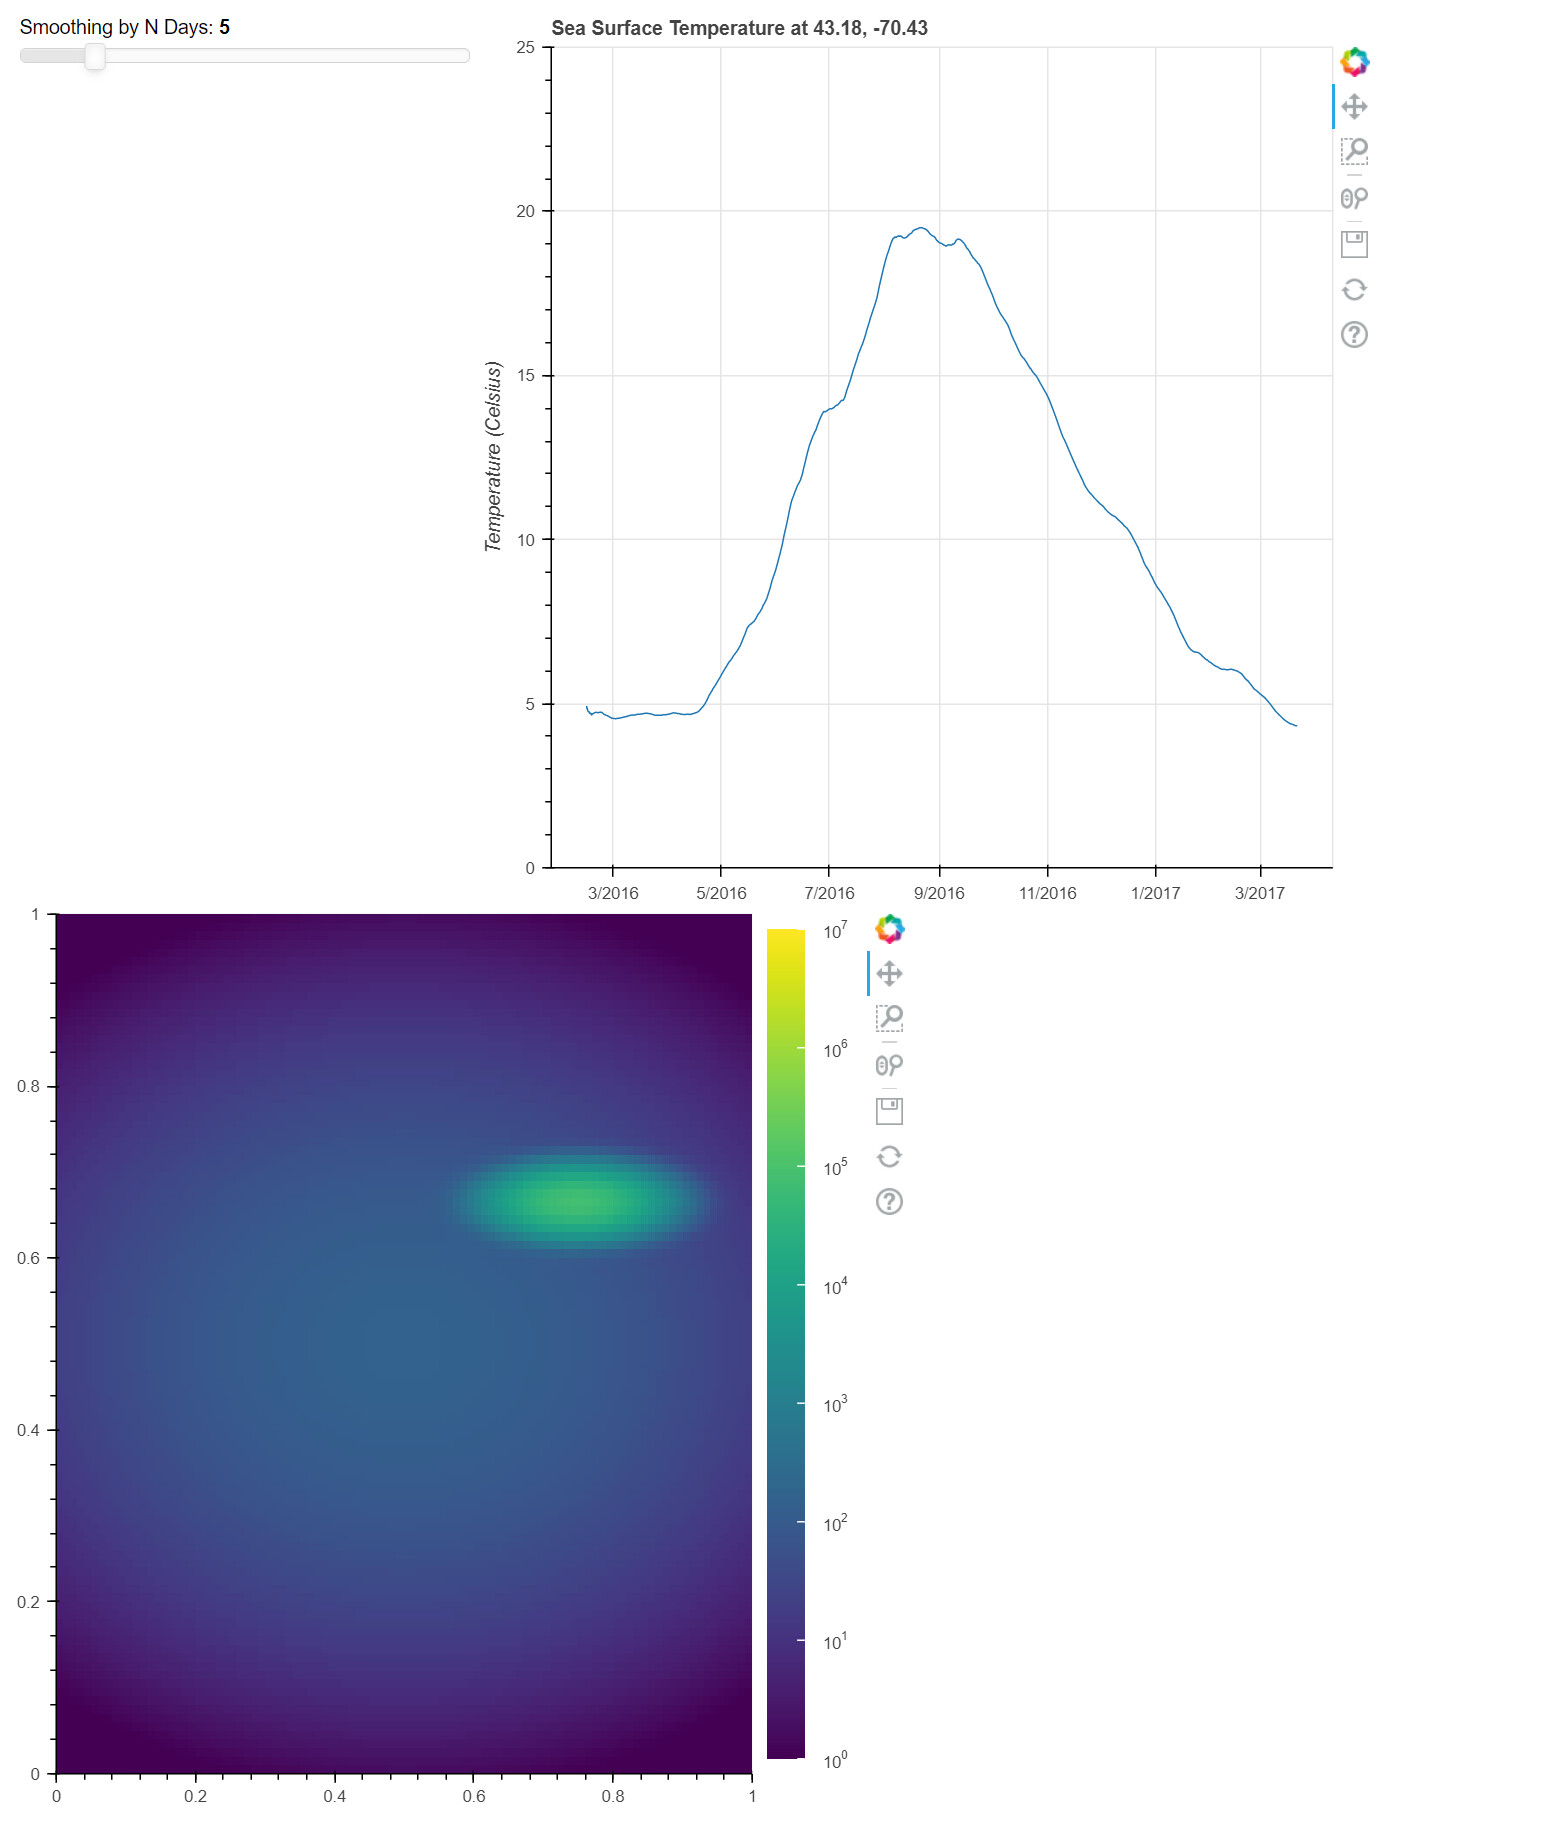
I want to update the heatmap image as the user slides the slider.

Issue:
the heatmap image is not updating when the slider is moved. the update image function is called, but the image is not updated on the browser.

Here is the minimal working example code


#     run python app.py

from bokeh.layouts import column
from bokeh.models import ColumnDataSource, Slider
from bokeh.plotting import figure
from bokeh.sampledata.sea_surface_temperature import sea_surface_temperature
from bokeh.server.server import Server
from bokeh.themes import Theme
from bokeh.layouts import L, row, column, gridplot, grid

import numpy as np

from bokeh.models import ColorBar, LogColorMapper
from bokeh.plotting import figure, output_file, show

image = None
df = sea_surface_temperature.copy()
source = ColumnDataSource(data=df)

def normal2d(X, Y, sigx=1.0, sigy=1.0, mux=0.0, muy=0.0):
    z = (X-mux)**2 / sigx**2 + (Y-muy)**2 / sigy**2
    return np.exp(-z/2) / (2 * np.pi * sigx * sigy)

def updateImageData(sliderval = 1):
    global image
    constantval = 10
    X, Y = np.mgrid[-3:3:100j, -2:2:100j]
    Z = normal2d(X, Y, 0.1, 0.2, 1.0, 1.0) + 0.1*normal2d(X, Y, 1.0, 1.0)
    image = Z * 1e6 * 1 / (sliderval * 100) 
    print("Debug-updateImageData: SliderVal: {0}", sliderval)

def createPlot():
    updateImageData()
    color_mapper = LogColorMapper(palette="Viridis256", low=1, high=1e7)

    plot = figure(x_range=(0,1), y_range=(0,1))
    plot.image(image=[image], color_mapper=color_mapper,
            dh=[1.0], dw=[1.0], x=[0], y=[0])

    color_bar = ColorBar(color_mapper=color_mapper, label_standoff=12)

    plot.add_layout(color_bar, 'right')

    return plot
    # show(plot)

def callback(attr, old, new):
    global source
    global df
    
    if new == 0:
        data = df
    else:
        data = df.rolling(f"{new}D").mean()
        updateImageData(new)
    source.data = ColumnDataSource.from_df(data)

def creataTempraturePlot():

    plot = figure(x_axis_type='datetime', y_range=(0, 25), y_axis_label='Temperature (Celsius)',
                  title="Sea Surface Temperature at 43.18, -70.43")
    plot.line('time', 'temperature', source=source)


    slider = Slider(start=0, end=30, value=0, step=1, title="Smoothing by N Days")
    slider.on_change('value', callback)
    
    return [slider, plot]
    
def bkapp(doc):
    doc.add_root(grid([creataTempraturePlot(),
                       [createPlot()]
                       ]))

    # doc.theme = Theme(filename="theme.yaml")

def startServer():   
    # Setting num_procs here means we can't touch the IOLoop before now, we must
    # let Server handle that. If you need to explicitly handle IOLoops then you
    # will need to use the lower level BaseServer class.
    server = Server({'/': bkapp})
    server.start()
    return server

if __name__ == '__main__':
    print('Opening Bokeh application on http://localhost:5006/')
    server = startServer()
    server.io_loop.add_callback(server.show, "/")
    server.io_loop.start()

output:

Bokeh glyphs are driven by ColumnDataSource objects, and only by ColumnDataSource objects. So if you want want glyphs (e.g. image glyphs) to update, you have to change the data property of their associated ColumnDataSource. That action is what Bokeh can auto-magically respond to.

You are doing that for the line glyph in callback when you assign source.data = <some new data>. But you never do that for the image data. The function updateImageData just updates a global numpy array without updating the data source, so basically that is an invisible no-op as far as Bokeh is concerned.

Thanks bryan makes sense. I got it to work.

here is the working code if anyone interested

#     run python app.py

from bokeh.layouts import column
from bokeh.models import ColumnDataSource, Slider
from bokeh.plotting import figure
from bokeh.sampledata.sea_surface_temperature import sea_surface_temperature
from bokeh.server.server import Server
from bokeh.themes import Theme
from bokeh.layouts import L, row, column, gridplot, grid
from bokeh.models import Image, ColumnDataSource
from bokeh.plotting import figure

import numpy as np
import pandas as pd

from bokeh.models import ColorBar, LogColorMapper
from bokeh.plotting import figure, output_file, show

# image = None
df = sea_surface_temperature.copy()
columnDataSourceLineSpace = ColumnDataSource(data=df)

columnDataSourceImage = ColumnDataSource(data=dict(image=[], x=[], y=[], dw=[], dh=[], colorMapper=[]))

def normal2d(X, Y, sigx=1.0, sigy=1.0, mux=0.0, muy=0.0):
    z = (X-mux)**2 / sigx**2 + (Y-muy)**2 / sigy**2
    return np.exp(-z/2) / (2 * np.pi * sigx * sigy)

def updateImageData(sliderval = 1):
    # global image
    global columnDataSourceImage
    constantval = 10
    X, Y = np.mgrid[-3:3:100j, -2:2:100j]
    Z = normal2d(X, Y, 0.1, 0.2, 1.0, 1.0) + 0.1*normal2d(X, Y, 1.0, 1.0)
    image = Z * 1e6 * 1 / (sliderval * 100)
    print("Debug-updateImageData: SliderVal: {0}", sliderval)
    color_mapper = LogColorMapper(palette="Viridis256", low=1, high=1e7)
    columnDataSourceImage.data = {'image': [image], 'x':[0], 'y':[0], 'dw':[1.0], 'dh':[1.0]}

def createPlot():
    updateImageData()
    color_mapper = LogColorMapper(palette="Viridis256", low=1, high=1e7)

    plot = figure(x_range=(0,1), y_range=(0,1))
    # plot.image(image=[columnDataSourceImage], color_mapper=color_mapper,
    #         dh=[1.0], dw=[1.0], x=[0], y=[0])
    
    image = Image(image='image', x='x', y='y', dw='dw', dh='dh', color_mapper=color_mapper)
    plot.add_glyph(columnDataSourceImage, glyph=image)
    
    color_bar = ColorBar(color_mapper=color_mapper, label_standoff=12)
    plot.add_layout(color_bar, 'right')

    return plot
    # show(plot)

def callback(attr, old, new):
    global source
    global df
    
    if new == 0:
        data = df
    else:
        data = df.rolling(f"{new}D").mean()
        updateImageData(new)
    columnDataSourceLineSpace.data = ColumnDataSource.from_df(data)

def creataTempraturePlot():

    plot = figure(x_axis_type='datetime', y_range=(0, 25), y_axis_label='Temperature (Celsius)',
                  title="Sea Surface Temperature at 43.18, -70.43")
    plot.line('time', 'temperature', source=columnDataSourceLineSpace)


    slider = Slider(start=0, end=30, value=0, step=1, title="Smoothing by N Days")
    slider.on_change('value', callback)
    
    return [slider, plot]
    
def bkapp(doc):
    doc.add_root(grid([creataTempraturePlot(),
                       [createPlot()]
                       ]))

    # doc.theme = Theme(filename="theme.yaml")

def startServer():   
    # Setting num_procs here means we can't touch the IOLoop before now, we must
    # let Server handle that. If you need to explicitly handle IOLoops then you
    # will need to use the lower level BaseServer class.
    server = Server({'/': bkapp})
    server.start()
    return server

if __name__ == '__main__':
    print('Opening Bokeh application on http://localhost:5006/')
    server = startServer()
    server.io_loop.add_callback(server.show, "/")
    server.io_loop.start()

2 Likes

This topic was automatically closed 90 days after the last reply. New replies are no longer allowed.