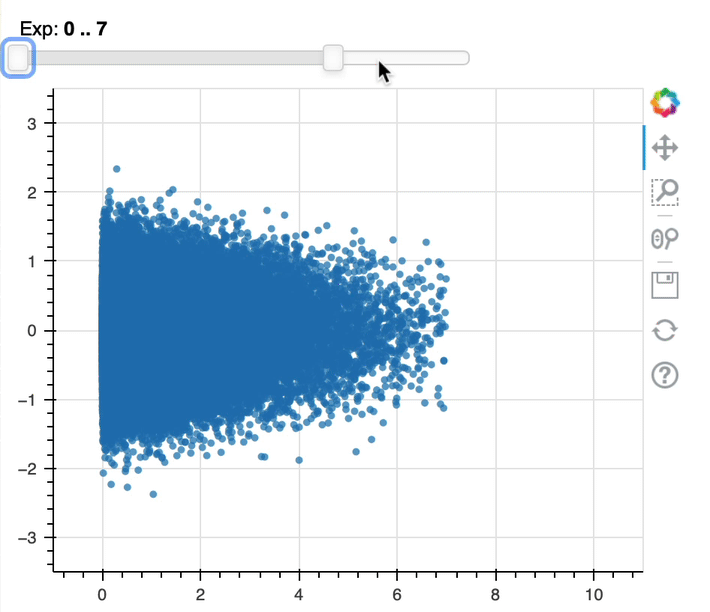
I wrote an interactive data visualization script with bokeh taking use of JavaScript callbacks (MWE below). The data filtering is noticeably slow starting at around 10k data points, and above 100k becomes impossible to work with. This is also observed when running the code within a Jupyter Notebook. This effect is mostly noticed in regions with more data points.
Is this expected? If not, how can I speed up the visualization?
General comments on the code, specifically related to correct/incorrect usage of bokeh's functionalities, are welcome.
Thank you.
import numpy as np
from bokeh.io import output_file, show
from bokeh.models import CDSView, ColumnDataSource as CDS, CustomJSFilter
from bokeh.models import CustomJS, RangeSlider, Range1d
from bokeh.plotting import Figure
from bokeh.layouts import layout
output_file('test.hml') # alternatively one could use output_notebook()

#generate the data
npoints = 50000
data = dict(exp=np.random.exponential(1, size=npoints),
            gau=np.random.normal(0, 0.5, size=npoints),
            )

source = CDS(data=data)

slider  = RangeSlider(start=0, end=10, value=(0, 10), step=.1, title="Exp")

callback = CustomJS(args=dict(s=source), code="""
    s.change.emit();
""")
slider.js_on_change('value', callback)

filt = CustomJSFilter(args=dict(slider=slider), code="""
        var indices = [];
        var start = slider.value[0];
        var end = slider.value[1];

        for (var i=0; i < source.get_length(); i++){
            if (source.data['exp'][i] >= start && source.data['exp'][i] <= end){
                indices.push(true);
            } else {
                indices.push(false);
            }
        }
        return indices;
        """)

view = CDSView(source=source, filters=[filt])

fig = Figure(plot_width=450, plot_height=350)
fig.circle(x='exp', y='gau', source=source, view=view)

#fix ranges (otherwise they change during filtering)
fig.x_range=Range1d(-1, 11)
fig.y_range=Range1d(-3.5, 3.5)

lay = layout([[slider], [fig]])
show(lay)
100k array push operations on every slider update seems like a lot. [1] Do you actually need to have things update on every intermediate value? The simplest thing to do is just to use the throttled slider value and only update at the end of the interaction, and not on every value in between. Otherwise there might be more efficient approaches to try, e.g. using pre-sized typed arrays instead of expensive appends.
See e.g. JavaScript Array.push Performance 400k pushes without a conditional already takes on the order of milliseconds, and a slider can be scrubbed much faster than that. Of course the plot itself has to re-render every time as well. Bokeh can’t magic away the cost of work, so I think the overall approach would need to be re-considered to avoid doing so much work on every slider update. ↩︎
Thank you for the reply.
I was not aware of the value_throttled replacement of value in the .js_on_change() call, which certainly helps. I would suggest to use this in some example in the documentation, since it might be quite useful to many users.
Regarding the array, I tried the following:
filt = CustomJSFilter(args=dict(slider=slider), code="""
        var indices = new Array(source.get_length());
        var start = slider.value[0];
        var end = slider.value[1];

        for (var i=0; i < source.get_length(); i++){
            if (source.data['exp'][i] >= start && source.data['exp'][i] <= end){
                indices[i] = true;
            } else {
                indices[i] = false;
            }
        }
        return indices;
        """)
but got no noticeable performance improvement.
Feel free to suggest a better solution: this kind of plot can be used for some exploratory data analysis, and thus in my opinion represents quite a common use-case scenario, for which I would expect good performance even for relatively large datasets. However, I understand the limitations.
@b-fontana when I run the code above the plot updates nearly instantly when the slider is done scrubbing. Are you saying you are seeing something different, or that this is not fast enough still, or?
In any case you can certainly improve things by removing the redundant lookpus and conditional inside the loop:
const exp = source.data['exp']

for (var i=0; i < source.get_length(); i++){
  indices[i] = exp[i] >= start && exp[i] <= end
}
If your real use case is a scatter circle you can also try setting the webgl backend:
Thank you for the answer and suggestions. The tool is now much faster.
I would like to add that I enjoy using bokeh very much. Congratulations for this great piece of software.