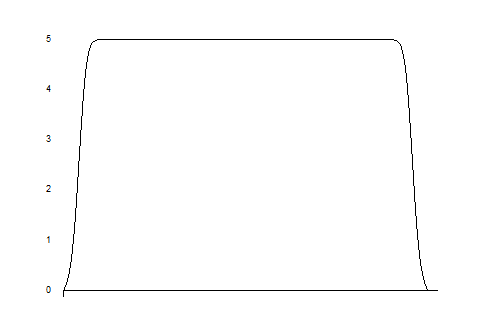
bokeh, Smooth curve, static html files

#!/usr/bin/python
#coding:utf-8
from bokeh.plotting import figure, output_file, show
from bokeh.models import FixedTicker
from numpy import arange

x = arange(0,36,1)
y = [0,0.5,4.8,5,5,5,5,5,5,5,5,5,5,5,5,5,5,5,5,5,5,5,5,5,5,5,5,5,5,5,5,5,5,4.8,0.5,0]
output_file(“fangbo.html”)

p = figure(plot_width=400, plot_height=400)
p.line(x,y)

show(p)

``

Hi,

I’m still new in bokeh.
I’m currently building on a visualization project with some discrete points,
such as x = arang(0,36,1) y = [0,0.5,4.8,5…(28)…5,4.8,0.5,0],I use
Then run this code I got a line chart, but I want to plot a smooth cruve
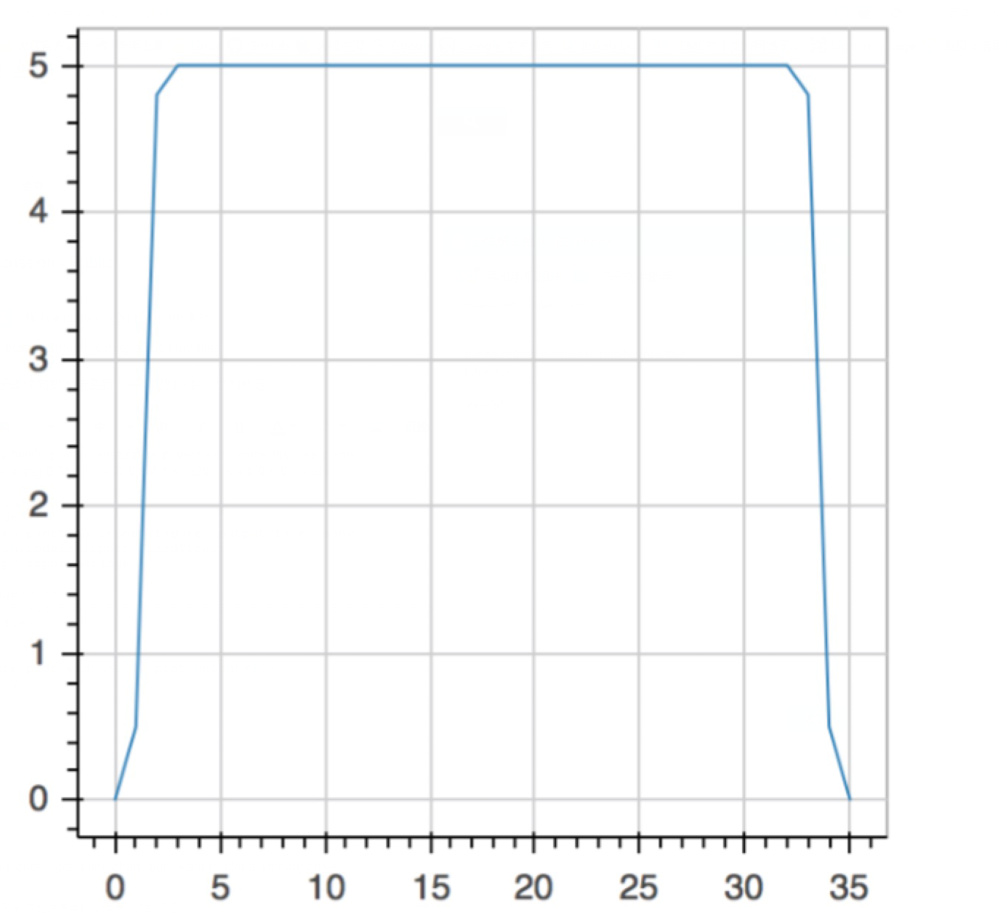
How can I fit the cruve to make it smooth.

Thanks a lot :slight_smile:

Shuai Yang

Hi,

This is not really a Bokeh question. In general, if you want the visualized curve to be more "smooth" then you need to show more points. In your code you have 35 x,y values. Depending on how "smooth" you want, you might want to increase that to several hundred x,y values. If this data came from some synthetic source, then hopefully you can just create more points (as many as you want). If these data are measurements, and you can't get or make additional measurements, then you will have to do some kind of interpolation. But Bokeh does not have anything built in for interpolation. For one thing, the right kind of interpolation is dependent the particulars of a user's situation, which we don't know anything about in general. To learn more about interpolating with Python you'd want to google search for "numpy interpolation" or "scipy interpolation", since numpy and scipy are the other different projects that would have functions to help you interpolate.

Bryan

···

On Jun 17, 2016, at 4:38 AM, [email protected] wrote:

Hi,

I'm still new in bokeh.
I'm currently building on a visualization project with some discrete points,
such as x = arang(0,36,1) y = [0,0.5,4.8,5...(28)...5,4.8,0.5,0],I use

#!/usr/bin/python
#coding:utf-8
from bokeh.plotting import figure, output_file, show
from bokeh.models import FixedTicker
from numpy import arange

x = arange(0,36,1)
y = [0,0.5,4.8,5,5,5,5,5,5,5,5,5,5,5,5,5,5,5,5,5,5,5,5,5,5,5,5,5,5,5,5,5,5,4.8,0.5,0]
output_file("fangbo.html")

p = figure(plot_width=400, plot_height=400)
p.line(x,y)

show(p)

Then run this code I got a line chart<Auto Generated Inline Image 1.png>, but I want to plot a smooth cruve<Auto Generated Inline Image 2.png>
How can I fit the cruve to make it smooth.

Thanks a lot :slight_smile:

Shuai Yang

--
You received this message because you are subscribed to the Google Groups "Bokeh Discussion - Public" group.
To unsubscribe from this group and stop receiving emails from it, send an email to [email protected].
To post to this group, send email to [email protected].
To view this discussion on the web visit https://groups.google.com/a/continuum.io/d/msgid/bokeh/21456b7d-de85-4f68-8941-52f8a999130f%40continuum.io\.
For more options, visit https://groups.google.com/a/continuum.io/d/optout\.
<Auto Generated Inline Image 1.png><Auto Generated Inline Image 2.png>

Thanks a lot for your answer, I will learn more about Python to achieve this goal.

Finally, I am very sorry for not timely feedback, because the Great Firewall in China.

在 2016年6月17日星期五 UTC+8下午9:31:58,Bryan Van de ven写道:

Hi,

This is not really a Bokeh question. In general, if you want the visualized curve to be more “smooth” then you need to show more points. In your code you have 35 x,y values. Depending on how “smooth” you want, you might want to increase that to several hundred x,y values. If this data came from some synthetic source, then hopefully you can just create more points (as many as you want). If these data are measurements, and you can’t get or make additional measurements, then you will have to do some kind of interpolation. But Bokeh does not have anything built in for interpolation. For one thing, the right kind of interpolation is dependent the particulars of a user’s situation, which we don’t know anything about in general. To learn more about interpolating with Python you’d want to google search for “numpy interpolation” or “scipy interpolation”, since numpy and scipy are the other different projects that would have functions to help you interpolate.

Bryan

Hi,

I’m still new in bokeh.

I’m currently building on a visualization project with some discrete points,

such as x = arang(0,36,1) y = [0,0.5,4.8,5…(28)…5,4.8,0.5,0],I use

#!/usr/bin/python

#coding:utf-8

from bokeh.plotting import figure, output_file, show

from bokeh.models import FixedTicker

from numpy import arange

x = arange(0,36,1)

y = [0,0.5,4.8,5,5,5,5,5,5,5,5,5,5,5,5,5,5,5,5,5,5,5,5,5,5,5,5,5,5,5,5,5,5,4.8,0.5,0]

output_file(“fangbo.html”)

p = figure(plot_width=400, plot_height=400)

p.line(x,y)

show(p)

Then run this code I got a line chart<Auto Generated Inline Image 1.png>, but I want to plot a smooth cruve<Auto Generated Inline Image 2.png>

How can I fit the cruve to make it smooth.

Thanks a lot :slight_smile:

Shuai Yang


You received this message because you are subscribed to the Google Groups “Bokeh Discussion - Public” group.

To unsubscribe from this group and stop receiving emails from it, send an email to [email protected].

To post to this group, send email to [email protected].

To view this discussion on the web visit https://groups.google.com/a/continuum.io/d/msgid/bokeh/21456b7d-de85-4f68-8941-52f8a999130f%40continuum.io.

For more options, visit https://groups.google.com/a/continuum.io/d/optout.

<Auto Generated Inline Image 1.png><Auto Generated Inline Image 2.png>

在 2016年6月17日星期五 UTC+8下午9:31:58,Bryan Van de ven写道:

···

On Jun 17, 2016, at 4:38 AM, [email protected] wrote:
Hi,

This is not really a Bokeh question. In general, if you want the visualized curve to be more “smooth” then you need to show more points. In your code you have 35 x,y values. Depending on how “smooth” you want, you might want to increase that to several hundred x,y values. If this data came from some synthetic source, then hopefully you can just create more points (as many as you want). If these data are measurements, and you can’t get or make additional measurements, then you will have to do some kind of interpolation. But Bokeh does not have anything built in for interpolation. For one thing, the right kind of interpolation is dependent the particulars of a user’s situation, which we don’t know anything about in general. To learn more about interpolating with Python you’d want to google search for “numpy interpolation” or “scipy interpolation”, since numpy and scipy are the other different projects that would have functions to help you interpolate.

Bryan

On Jun 17, 2016, at 4:38 AM, [email protected] wrote:

Hi,

I’m still new in bokeh.

I’m currently building on a visualization project with some discrete points,

such as x = arang(0,36,1) y = [0,0.5,4.8,5…(28)…5,4.8,0.5,0],I use

#!/usr/bin/python

#coding:utf-8

from bokeh.plotting import figure, output_file, show

from bokeh.models import FixedTicker

from numpy import arange

x = arange(0,36,1)

y = [0,0.5,4.8,5,5,5,5,5,5,5,5,5,5,5,5,5,5,5,5,5,5,5,5,5,5,5,5,5,5,5,5,5,5,4.8,0.5,0]

output_file(“fangbo.html”)

p = figure(plot_width=400, plot_height=400)

p.line(x,y)

show(p)

Then run this code I got a line chart<Auto Generated Inline Image 1.png>, but I want to plot a smooth cruve<Auto Generated Inline Image 2.png>

How can I fit the cruve to make it smooth.

Thanks a lot :slight_smile:

Shuai Yang


You received this message because you are subscribed to the Google Groups “Bokeh Discussion - Public” group.

To unsubscribe from this group and stop receiving emails from it, send an email to [email protected].

To post to this group, send email to [email protected].

To view this discussion on the web visit https://groups.google.com/a/continuum.io/d/msgid/bokeh/21456b7d-de85-4f68-8941-52f8a999130f%40continuum.io.

For more options, visit https://groups.google.com/a/continuum.io/d/optout.

<Auto Generated Inline Image 1.png><Auto Generated Inline Image 2.png>