I need the hovers to “stick” so that users can click on them. I followed an SO post (cant seem to find it now) and have a working code, but the problem is that my page becomes too slow and sometimes unresponsive. I also tried to build a custom tool following this post, but it doesnt work with version 2.2.3. My requirements are as follows:
- The hover needs to stay so that users can click on it (and may be select/copy stuff)
- Im rendering bokeh json from client side using Bokehe.embed. There are several plots in a page, so I need to get absolute page coordinates from
cb_data.geometry.sx,sy - Im plotting a heatmap
Im using Bokeh 2.2.3 Here is my code
p = figure(
    x_range=list(self.date_resolver.x_range()),         # just some xrange values
    y_range=list(df[self.col].unique()),                # just some yrange values
    x_axis_location="above",
    plot_width=925,
    plot_height=max(
        df[self.col].nunique() * self.height_scaling_factor, self.min_height    # project specific height, but can be anything
    ),
    toolbar_location=None,
    min_border_right=175,
    min_border_left=330,
)

# add rect
rects = p.rect(
    x="SCALE",
    y=self.col,
    width=1,
    height=1,
    source=df,
    fill_color={"field": "COUNT", "transform": mapper},
    line_color=None,
)

html_text = """
<style>
 td, th {{
     border: 1px solid #ddd;
     text-align: left;
     padding: 8px;
 }}

 tr:nth-child(even) {{
     background-color: #f2f2f2;
 }}
</style>
<div id="tooltip" style="border-style: solid;border-width: 2px;
         padding:5px;
         margin:0;
         overflow-y:auto;
         background-color: white;
         border: 0.5px solid #0B0B37;
         border-radius:6px;
         -moz-border-radius:6px;
         -webkit-border-radius:6px;
         z-index:1000;">
    <div>
        <table style="
                      font-family: Arial, Helvetica, sans-serif;
                      border-collapse: collapse;
                      width: auto;
                      display: block;
                      background-color: white;
                      border: 0.5px solid #F1F1F1;
                      ">
            <tr><td>{}</td>
                <td>{}</td>
                <td>{}</td>
            </tr>
            <tr><td>field_value</td>
                <td>_count</td>
                <td>_pages</td>
            </tr>
        </table>
    </div>
"""


# Adjust Hover
text = html_text.format(self.field.title(), "Count", "Pages")
div = Div(
    width=200,
    # height=100,
    name="tooltipper",
)

# JS Code
code = """
function removeChildren() {
    Array.from(document.getElementsByClassName("bk-root")).forEach(elem => {
        if (elem.id == "") {
            elem.parentNode.removeChild(elem);
        }
    });
}

// Im adding an event listener as I need page coordinates to plot the
// hover. If i take cb_data.geometry.sx or sy, im getting relative coordinates
// which might work fine if theres only a single plot in the entire page


document.addEventListener("mousemove", onMouseUpdate);
function onMouseUpdate(e) {
    let xCoord = e.pageX;
    let yCoord = e.pageY;
    let indices = cb_data.index.indices;
    if (indices.length > 0) {
        const idx = indices[0];
        //fieldValue, pages, and count, im dynamically updating on the hover

        let fieldValue = cb_data.renderer.data_source.data.DISPLAY_NAME[idx],
            pages = cb_data.renderer.data_source.data.PAGES[idx],
            count = cb_data.renderer.data_source.data.COUNT[idx];
        let map = { field_value: fieldValue, _count: count, _pages: pages };
        let newText = text.replace(/field_value|_count|_pages/gi, str => map[str]);
        div1.text = newText;

        let id = cb_data.renderer.document._roots[0].id;
        let bokehDoc = Bokeh.documents.filter(doc => doc._roots[0].id == id)[0];

        if (bokehDoc.roots().length > 1) {
            bokehDoc.remove_root(bokehDoc.roots()[1]);
            removeChildren();
            bokehDoc.add_root(div1);
        } else bokehDoc.add_root(div1);


        let len = document.getElementsByClassName("bk-root").length;
        let div = document.getElementsByClassName("bk-root")[len - 1];
        div.style = `\
position:absolute;\
left: ${xCoord + 15}px;\
top: ${yCoord}px;\
`;
    }
}
"""
callback1 = CustomJS(args=dict(div1=div, text=text), code=code)

# callback2 is for tap tool, hovers should disappear after tap event
callback2 = CustomJS(
    code="""
  Array.from(document.getElementsByClassName('bk-root')).forEach(div => {
     if (div.id=="") div.style.display = "none"});
"""
)

hover = HoverTool()
hover.callback = callback1
hover.tooltips = None
hover.renderers = [rects]
p.add_tools(hover)
p.js_on_event("tap", callback2)

# Add ColorBar to right
p.add_layout(color_bar, "right")
p.title = Title(text=title.replace("_", " "))
return p
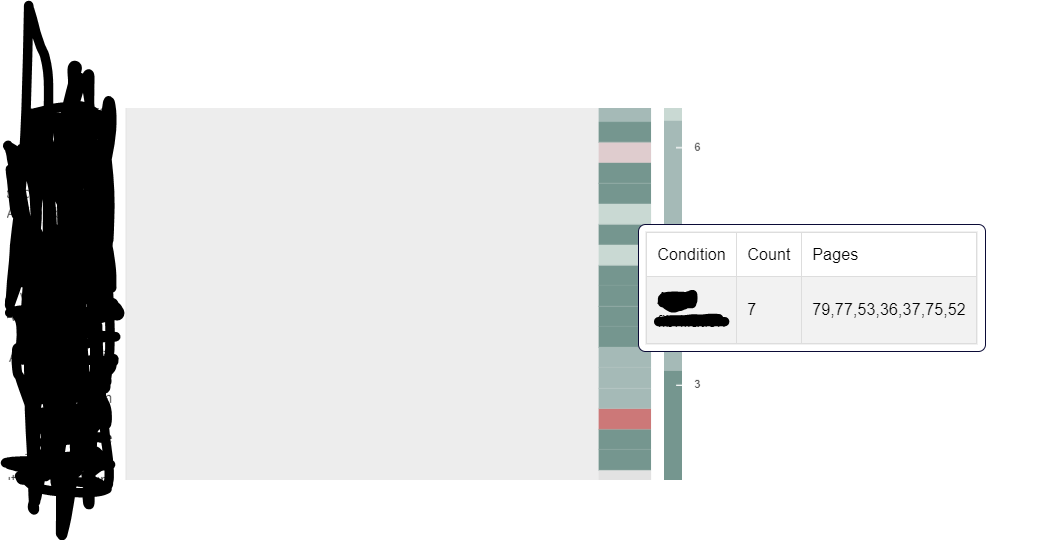
I get the hover like below, but as I said, the hovers render slowly and the entire page becomes slow.