@Bryan this is the minimal example to reproduce my problem (hope it will be enough).
from bokeh.plotting import figure
from bokeh.tile_providers import CARTODBPOSITRON, get_provider
from bokeh.models import GeoJSONDataSource
import geopandas as gpd
import shapely.geometry as sg
import json
from bokeh.io import show, output_notebook
import numpy as np
output_notebook(hide_banner=True)
tile_provider = get_provider(CARTODBPOSITRON)
p = figure(x_range=(0.0,22000000),y_range=(0,6500000),x_axis_type="mercator", y_axis_type="mercator")
p.add_tile(tile_provider)
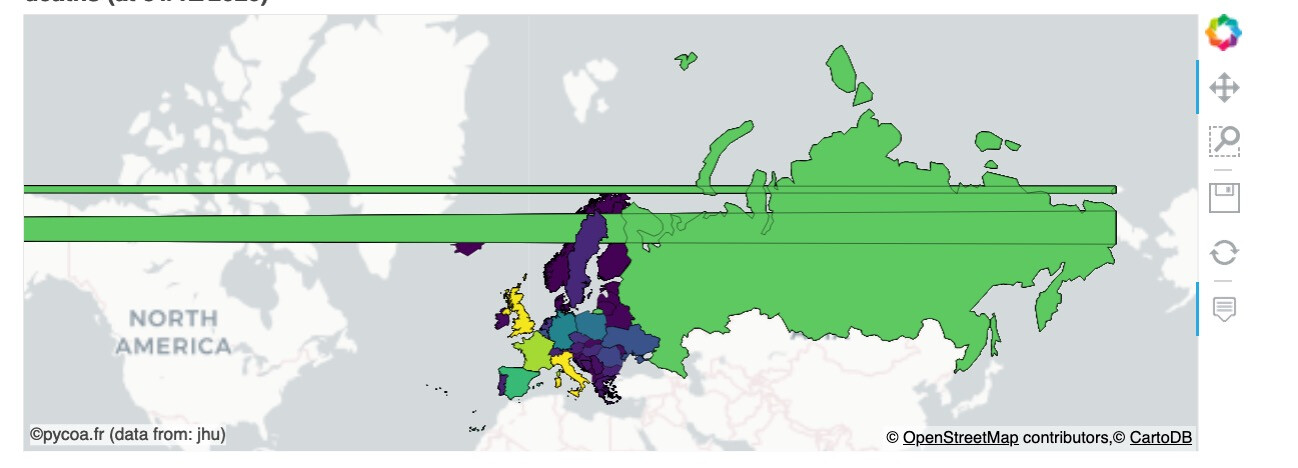
#this Polygon is a very small part of Russia
p1=sg.Polygon([(180,70.832199), (178.903425 ,70.78113999),(178.7253, 71.0988),(180 ,71.515714), \
(180.12812 ,71.55762),(180.97567 ,71.55553),(182.4255, 71.26948),(182.325 ,71.19),\
(181.30622 ,70.893020),(180,70.832199)])
gg=gpd.GeoDataFrame({'geoid':1,'location':'PartofRussia','geometry':gpd.GeoSeries(p1)},crs="EPSG:4326")
gg2 = gg.copy()
gg = gg.set_index("geoid")
# Project using EPSG:3857 to fit with WEB mercator
gg['geometry'] = gg['geometry'].to_crs('EPSG:3857')
json_data = json.dumps(json.loads(gg.to_json()))
geosource = GeoJSONDataSource(geojson = json_data)
p.patches('xs','ys', source = geosource,fill_color = 'green',
line_color = 'black', line_width = 0.25, fill_alpha = 1)
# As you can see this draw a horizaontal bar from east to west (it should not)
# This antimeridian problem seems to be a recurrent one
# see for instance https://stackoverflow.com/questions/53772047/folium-and-the-meridians-180-180
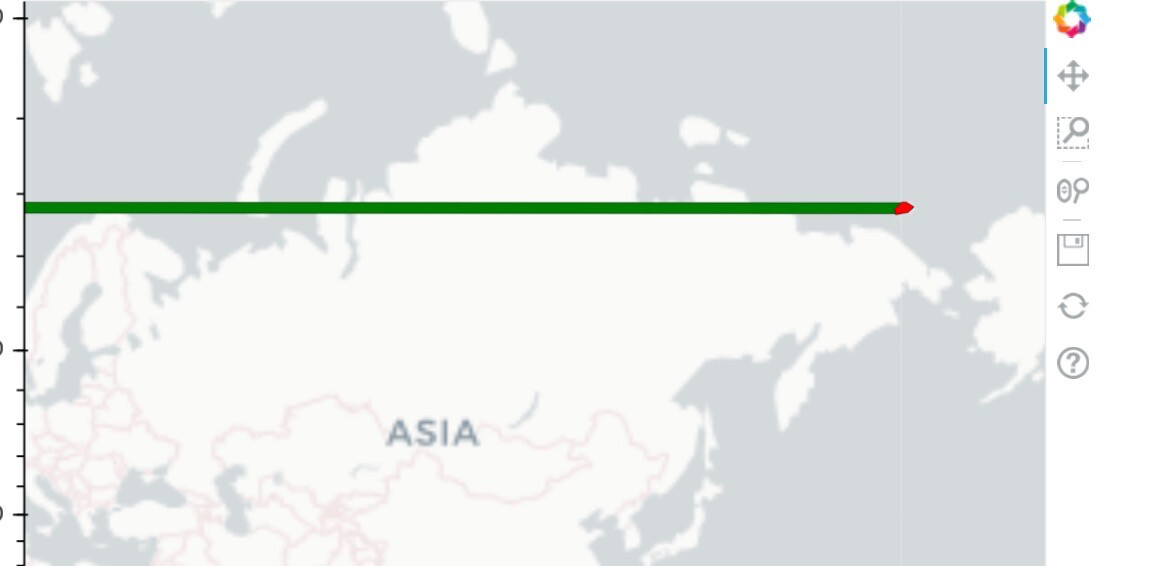
# If I use this formula (and not to_crs('EPSG:3857') method) it seems to solve it
# ref : https://stackoverflow.com/questions/57178783/how-to-plot-latitude-and-longitude-in-bokeh
def wgs84_to_web_mercator(tuple_xy):
"""Converts decimal longitude/latitude to Web Mercator format"""
k = 6378137
x = tuple_xy[0] * (k * np.pi/180.0)
y = np.log(np.tan((90 + tuple_xy[1]) * np.pi/360.0)) * k
return x,y
new=[sg.Polygon([wgs84_to_web_mercator(t) for t in p.exterior.coords]) for p in gg2.geometry]
gg2['geometry']=gpd.GeoSeries(new)
gg2 = gg2.set_index("geoid")
json_data = json.dumps(json.loads(gg2.to_json()))
geosource = GeoJSONDataSource(geojson = json_data)
p.patches('xs','ys', source = geosource,fill_color = 'red',
line_color = 'black', line_width = 0.25, fill_alpha = 1)
show(p)
In green the to_crs(‘EPSG:3857’) problem and in red the solution I have implemented to solve it…