First of all, thank you for the fantastic software. I am working on a viewer for large images using WMTSTileSource and my own tile server. I am really impressed with the functionality, but I am struggling with seams between each tile and cannot find a way to get rid of them. I know these seams are not part of the tiles, and even the demo have them. Example code:
import numpy as np

from bokeh.layouts import layout
from bokeh.models import Div, Range1d
from bokeh.plotting import figure, show


# helper function for coordinate conversion between lat/lon in decimal degrees to web mercator
def lnglat_to_meters(longitude: float, latitude: float) -> tuple[float, float]:
    """ Projects the given (longitude, latitude) values into Web Mercator
    coordinates (meters East of Greenwich and meters North of the Equator).

    """
    origin_shift = np.pi * 6378137
    easting = longitude * origin_shift / 180.0
    northing = np.log(np.tan((90 + latitude) * np.pi / 360.0)) * origin_shift / np.pi
    return (easting, northing)

description = Div(text="""<b><code>tile_demo.py</code></b> - Bokeh tile provider examples. Linked Pan and Zoom on all maps!""")

# Lady Bird Lake, Austin Texas
lat = 30.268801
lon = -97.763347

east, north = lnglat_to_meters(lon, lat)
dist = 1000 # distance from map center

x_range = Range1d(east-dist, east+dist) #  eastings range (m)
y_range = Range1d(north-dist, north+dist) # northings range (m)

providers = [
    "CartoDB Positron",
    "CartoDB Positron retina",
    "OpenStreetMap Mapnik",
    "OpenTopoMap",
    "USGS.USTopo",
    "Esri World Imagery",
]

plots = []
for i, vendor_name in enumerate(providers):
    plot = figure(
        x_range=x_range, y_range=y_range,
        x_axis_type="mercator", y_axis_type="mercator",
        height=250, width=300,
        title=vendor_name,
        toolbar_location=None, active_scroll="wheel_zoom",
    )
    plot.add_tile(vendor_name)
    plot.grid.visible = False
    plots.append(plot)

layout = layout([
    [description],
    plots[0:3],
    plots[3:6],
])

show(layout)
Note I disabled the grid with plot.grid.visible = False, but seams still appear:
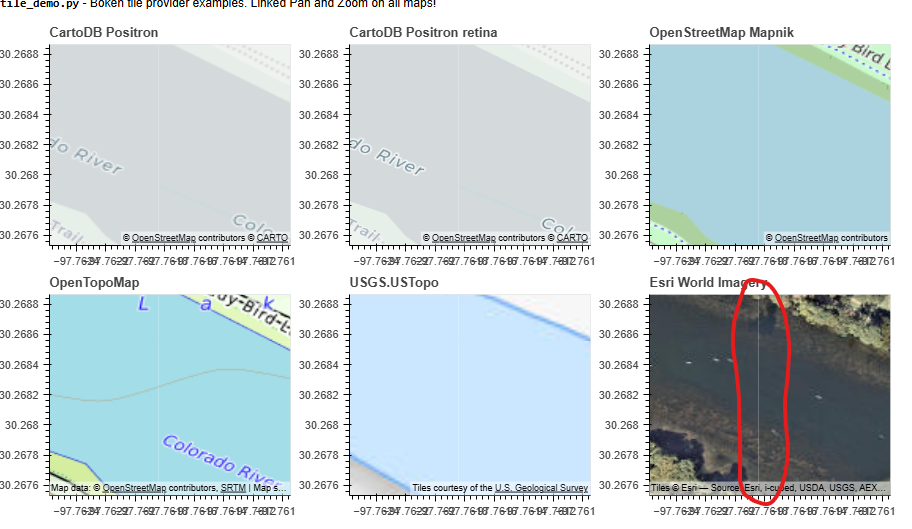
Does anyone know how to get rid of this and have tiles truly connect seamlessly?