ghomem
March 28, 2022, 1:35am
1
Hi,
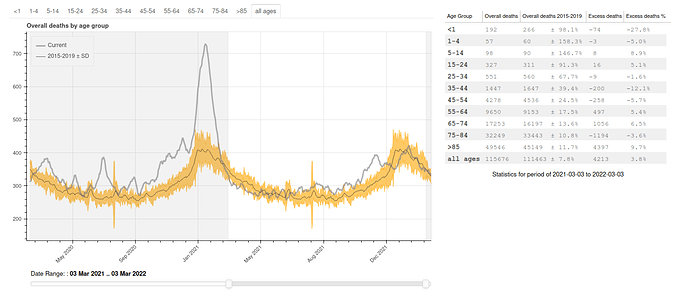
I guess that the integration of time series over custom intervals might be a common need. Here is an example that uses date ranges and plot annotations to integrate over a visually highlighted time window:
The stats table gets updated on a callback, as a function of the highlighted window.
P.S. Bokeh rocks
2 Likes
Bryan
March 28, 2022, 5:04am
2
Thanks for the kind words! That’s a great looking example, do you mind if we tweet it out from the Bokeh Twitter account?
2 Likes
ghomem
March 28, 2022, 8:16am
3
Hi @Bryan ,
Feel free to tweet. My handle is @remotegus .
By the way, the implementation above is live at page 4 here: https://coviz.io
Thanks for the support you have provided multiple times
1 Like
Very nice app. Are you doing the data crunching via python (like a pandas agg function or something) or w JS?
1 Like
ghomem
March 28, 2022, 11:28pm
5
Hi @gmerritt123 ,
Everything is done via Python. That is what got me into bokeh. The code is open:
Cheers
2 Likes
![]()
