Bokeh: update zoom plot (or axis rescaling) when hide series on legend

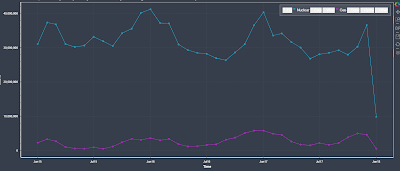
Hi all, I have the following graph in Bokeh:

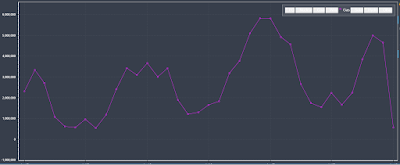
I’d like to know if there are some commands in Bokeh library that allows me to update the y axis (or box zoom my plot) when I hide some series on the legend. Example: when I hide the blue time series from the interactive legend, I’d like the purple one to be rescaled (in this way the purple series does not look flattened). The result:

Thank you!

Hi,

There is no direct way to accomplish this, but I think you can do this indirectly by attaching a callback to the glyph renderer's "visible" property. Here is a complete example to get you started:

    import pandas as pd

    from bokeh.models import CustomJS
    from bokeh.palettes import Spectral4
    from bokeh.plotting import figure, output_file, show
    from bokeh.sampledata.stocks import AAPL, IBM, MSFT, GOOG

    p = figure(plot_width=800, plot_height=250, x_axis_type='datetime')
    p.title.text = 'Click on legend entries to hide lines'

    for data, name, color in zip([AAPL, IBM, MSFT, GOOG], ["AAPL", "IBM", "MSFT", "GOOG"], Spectral4):
        df = pd.DataFrame(data)
        df['date'] = pd.to_datetime(df['date'])
        r = p.line(df['date'], df['close'], line_width=2, color=color, alpha=0.8, legend=name)
        r.js_on_change('visible', CustomJS(code='console.log("VISIBLE CHANGED")'))

    p.legend.location = 'top_left'
    p.legend.click_policy = 'hide'

    output_file('interactive_legend.html', title='interactive_legend.py example')

    show(p)

The critical part is the CustomJS where it provide JavaScript code to print VISIBLE CHANGES to the browser JS code. You can change that to update ranges, etc. There is a good amount of documentation and examples of CustomJS callback usage here:

  https://bokeh.pydata.org/en/latest/docs/user_guide/interaction/callbacks.html

I'm assuming that you are asking about "standalone" Bokeh documents. If this is a Bokeh server app then the above works but you could also use a real python callback with "on_change" instead.

Thanks,

Bryan

···

On Jan 9, 2018, at 10:40, David Laguardia <[email protected]> wrote:

Hi all, I have the following graph in Bokeh:

I'd like to know if there are some commands in Bokeh library that allows me to update the y axis (or box zoom my plot) when I hide some series on the legend. Example: when I hide the blue time series from the interactive legend, I'd like the purple one to be rescaled (in this way the purple series does not look flattened). The result:

Thank you!

--
You received this message because you are subscribed to the Google Groups "Bokeh Discussion - Public" group.
To unsubscribe from this group and stop receiving emails from it, send an email to [email protected].
To post to this group, send email to [email protected].
To view this discussion on the web visit https://groups.google.com/a/continuum.io/d/msgid/bokeh/13b43530-83e2-4cc0-b62f-9f39cb897007%40continuum.io\.
For more options, visit https://groups.google.com/a/continuum.io/d/optout\.
I’m trying to do this same task and I’m completely stumped. Any suggestions would be gratefully received.

I started with this code: python 3.x - Bokeh: update zoom plot when hide something on legend - Stack Overflow as shown in this notebook: Jupyter Notebook Viewer

In my browser, I get an error message:
VM235:14 Uncaught TypeError: Cannot read property ‘update_dataranges’ of undefined
at flx_cb (eval at get (bokeh-1.3.1.min.js:31), :14:36)
at eval (eval at get (bokeh-1.3.1.min.js:31), :17:1)
at n.execute (bokeh-1.3.1.min.js:31)
at e. (bokeh-1.3.1.min.js:31)
at e.t.emit (bokeh-1.3.1.min.js:31)
at e.emit (bokeh-1.3.1.min.js:31)
at e._setv (bokeh-1.3.1.min.js:31)
at e.setv (bokeh-1.3.1.min.js:31)
at e.set [as visible] (bokeh-1.3.1.min.js:31)
at e.on_hit (bokeh-1.3.1.min.js:31)

To state the obvious, it looks like plot_canvas_view is undefined. My assumption was, this has been renamed something else since this code was written, so I tried various options in the JavaScript but couldn’t find anything that worked.

I tried to do the whole thing in on_change (I’m building a complete Bokeh app to run in a server), but there’s no attribute have_updated_interactively on y_range anymore. Beyond this, i couldn’t find any equivalent of update_dataranges in the 1.3.1 Bokeh code.

All help gratefully received!

BTW - I did look on Github to see if there’s a ticket - but I couldn’t find anything relevant. I’m happy to add it if people think there isn’t a ticket already.

I’m on version 1.3.1

Since 0.12.13, all of BokehJS was ported to TypeScript and the entire layout subsystem was rewritten from scratch. Here is an updated version below. Note that it does not use CustomJS.from_py_func which has been deprecated for quite some time and will 100% be removed in the upcoming 2.0 release.

callback = """
    y_range = fig.y_range
    y_range.have_updated_interactively = false
    y_range.renderers = []
    for (let it of legend.items) {
        for (let r of it.renderers) {
            if (r.visible)
                y_range.renderers.push(r)
        }
    }
    Bokeh.index[fig.id].update_dataranges()
"""

for item in legend.items:
    item.renderers[0].js_on_change("visible",
         CustomJS(args=dict(fig=fig, legend=fig.legend[0]), code=callback))

FYI this is pretty esoteric usage, so I’m not implicitly making any guarantees about this long-term, either. We are not yet at a point where the BokehJS API can be considered completely stable. A better path is to make an issue for adding supported events around legend interactions that can be maintained under test.

Thanks for your quick reply Bryan. I’ve raised this as a new feature request here: Axis rescaled when legend item visibility changed [FEATURE] · Issue #9144 · bokeh/bokeh · GitHub

I managed to get your solution to work in a standalone Bokeh test, but it’s not working for me in my large scale Bokeh application. I’m getting a null for Bokeh.index[fig.id]. If I find out what’s going on, and it’s something worth sharing, I’ll share it here.

Thanks again.

I couldn’t get to the bottom of this and I’ve timed out of my allocated project time. I have one of two thoughts here:

  1. it could be something to do with running on the server than a standalone app - I doubt this is the case
  2. it could be because my figure is nested within other elements, specifically, it’s in a panel in a tab

Bokeh.index is mostly a quick hack that was added years ago for a specific situation. It’s not something we really ever advertise or document. So I can imagine it might be possible for it to get clobbered when there are multiple embeddings (that’s one explanation I can think of for Bokeh.index[fig.id] to be null). If you ever have a minimal, complete reproducer that you can share, please make an issue with it.

I’m on Bokeh 1.3.4 and I’ve managed to hack the custom JS from @Bryan, above. This JS callback searches down the index tree for all PlotView objects, and then trigger their update_dataranges() method:

# Bokeh JS callback to adjust y-axis zoom based on legend selection.
update_y_zoom = """
    y_range = fig.y_range
    y_range.have_updated_interactively = false
    y_range.renderers = []
    for (let it of legend.items) {
        for (let r of it.renderers) {
            if (r.visible)
                y_range.renderers.push(r)
        }
    }
    if (Bokeh.index[fig.id]) {
        Bokeh.index[fig.id].update_dataranges()
    }
    else {
        function update_all_plot_views(el) {
            for (let v of el.child_views) {
                if (v.__proto__.constructor.__name__ == 'PlotView') {
                    v.update_dataranges()
                }
                else {                
                    if (v.child_views) {
                        update_all_plot_views(v)
                    }
                }
            }
        }
        let root = Bokeh.index[Object.keys(Bokeh.index)]
        update_all_plot_views(root)
    }
"""

It’s doing the trick for me. You may need to adapt it specifically to your needs/layout. Tip: add some console.log lines to the JS code to help you inspect objects in the browser.

Just a heads up, If you are using the axis autoranger DataRange1d On Bokeh 2.0.2 (here in the docs), there is a super useful parameter called only_visible that sets the ranges only according to the visible renderers. This way, there’s no need to write a callback to achieve :smiley:.

Thanks so much Bokeh Team!

1 Like