Hi All!
I’m a (python data stack) data scientist with a predilection towards data viz. I’ve recently taken a bit of a sojourn into Bokeh-land. I’ve found Bokeh to be an incredibly powerful library with a ton of cool features, but I also ran in to a number of pain points which ultimately led me to elect not to use Bokeh for my work at this time (though I’m still tinkering with it on the side). I just wanted to document some of the issues I encountered at a high level to provide some ‘user research’, if you will, that may be instructive for the team as you move towards v1.0. I’m mostly documenting pain points here, but I really do think Bokeh is an awesome library with great potential – I don’t mean at all to be critical, I just want to provide feedback in case it proves useful (caveating all this with: I know you are short-handed and doing the best you can with limited resources!).
At a super high level, the main problems I ran into were:
(1) Documentation
(2) Interactivity
(1) Documentation:
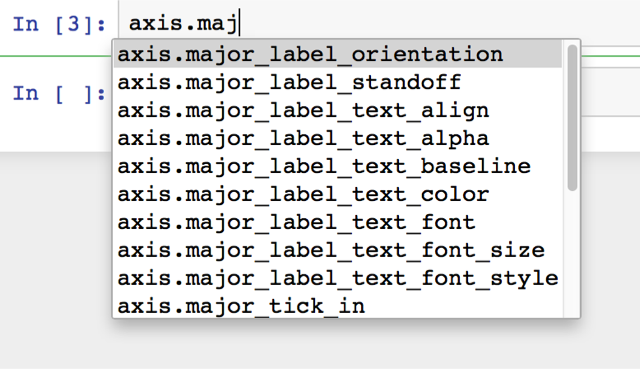
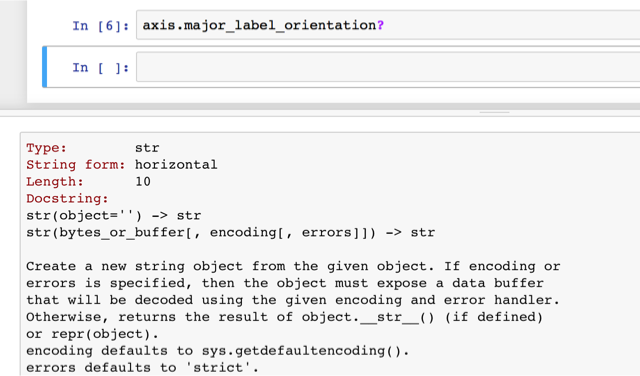
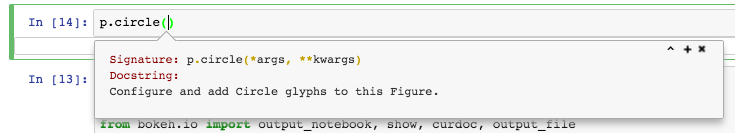
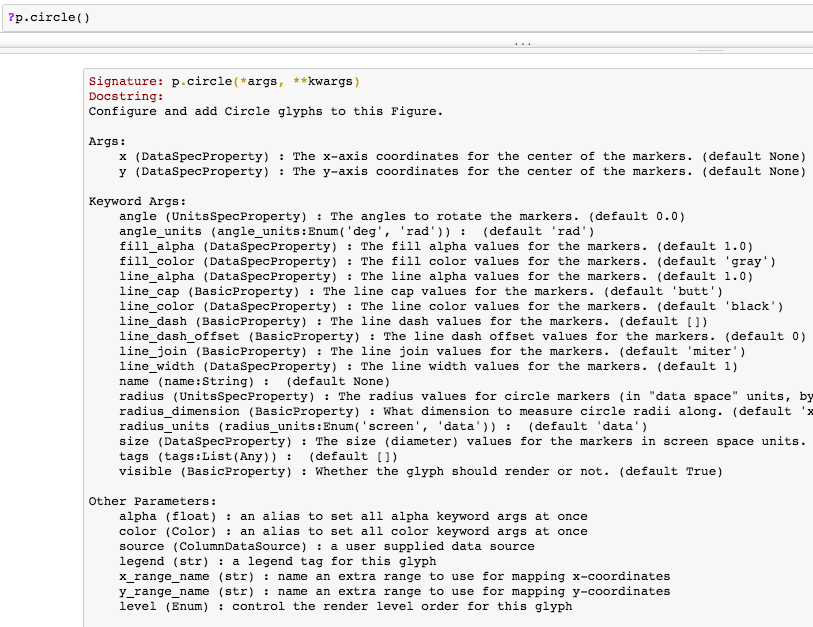
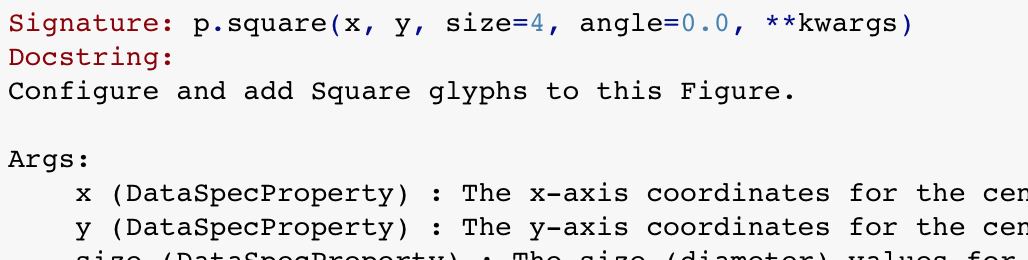
To me this is really the only thing that is a must-fix before v1.0, and really the only thing that would prevent extremely widespread adoption of Bokeh. The current state of the documentation is a serious blocker for non-engineers trying to work with Bokeh. The single biggest problem is the **KWARGS! problem. Put simply, while using a jupyter notebook attempts to quickly view documentation using the shift-tab notebook feature (or %psource, ‘?’, etc) are futile. Most functions and class instances merely note that they take args and kwargs, and don’t provide relevant options and customizations that a user would be looking for.
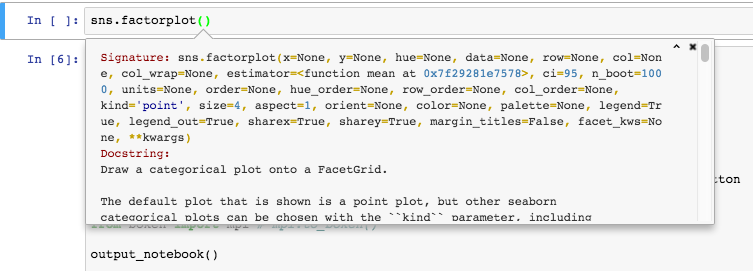
The ‘give a list of valid options when user enters an invalid option’ feature is genuinely brilliant, but it is not a substitute for quick, easy, access to full-bodied readme docs. Unfortunately the API reference on the site often falls prey to the same issue, and even when it doesn’t the available options are often undocumented, or sparsely documented. Compared to the docs for, say, seaborn, which provide full options, extensive details, and extensive examples right on the same page, Bokeh lags. This is critical for quick iteration in the data analytics world. In seaborn I can fix a syntax problem very quickly by consulting the site or shift-tabbing. In Bokeh often times I had to abandon such efforts after 30 minutes of searching with no answer. Improving the API references and the, related, readme references, are from a user experience side the highest priority open tasks for Bokeh. I honestly feel documentation improvements are more valuable than any plausible feature that could be added before v1.
The user guide is a valuable supplement, but it is much harder to diagnose a problem with command XYZ by going to the user guide than by knowing which command to look up for examples in the API reference or, even better, with a simple shift-tab (or %psource, etc) in notebook. The demos are likewise awesome, but have a similar concern. Also, many things are available in github examples only and not online, which is a minor annoyance. The user guide and examples also fall short in the area I would say is by far Bokehs core competency, interactivity.
(2) Interactivity
I was drawn to Bokeh by the powerful (and hopefully simple!) interactive elements. In particular, ability to use widgets to control plots in an interactive manner in static html. Jupyter widgets already make it super easy to get chart interactivity, but this is harder to port to static webpage contexts. I don’t really have any background in JS, and I found it very difficult to navigate the docs for adding interactivity in a static html context. The from_pyfunc() function proved too limited, which is understandable, but richer docs (with explanations) for CustomJS would be helpful.
Bokeh server certainly has a ton of value for certain solutions, but most of the time a light weight solution is vastly preferable. Where the server really shines is in the potential to have the extremely elusive ‘shiny for python’ type dashboard experience. This experience includes Bokeh server but would also include pre-built infrastructure to easily add ready-made sidebars, filters, formatting options, etc. as Shiny provides. These are all doable with Bokeh, certainly, but a dashboarding solution would make them simple and painless. At least in the data science part of the world this is where Bokeh server shines, and I’d love to see Bokeh server target this use case, which is a HUGE open need in the #pydata stack. For someone with absolutely no background in software engineering setting up an internal-network-facing dashboard application served by Bokeh server is currently a dream, contrasted with Shiny.
To this one user’s eyes Bokeh has a clear fit in the #pydata stack, and that fit is in (1) making it easy to publish interactive, widget driven visualizations that function in static html, and (2) providing the first genuinely viable counterpart to shiny for python. Libraries like seaborn will always be better for exploratory, quick visualizations, and that is totally ok. Bokeh has a huge opportunity space, and I feel it is well poised to fill that space. I think focusing in those areas will provide the easiest wins, compared to trying to reinvent the billion things one can already do in matplotlib. Focusing on interactivity and dashboarding solutions will, to my eyes, facilitate the broadest Bokeh adoption.
I really love what I’ve seen out of Bokeh so far, and I hope this user research proves somewhat helpful. I know there are many limitations on the time of all Bokeh developers and I stress again that none of this is intended to be critical in any way. I would be happy to follow up and discuss my experiences more insofar as that would be valuable.
    Best,

    Stu