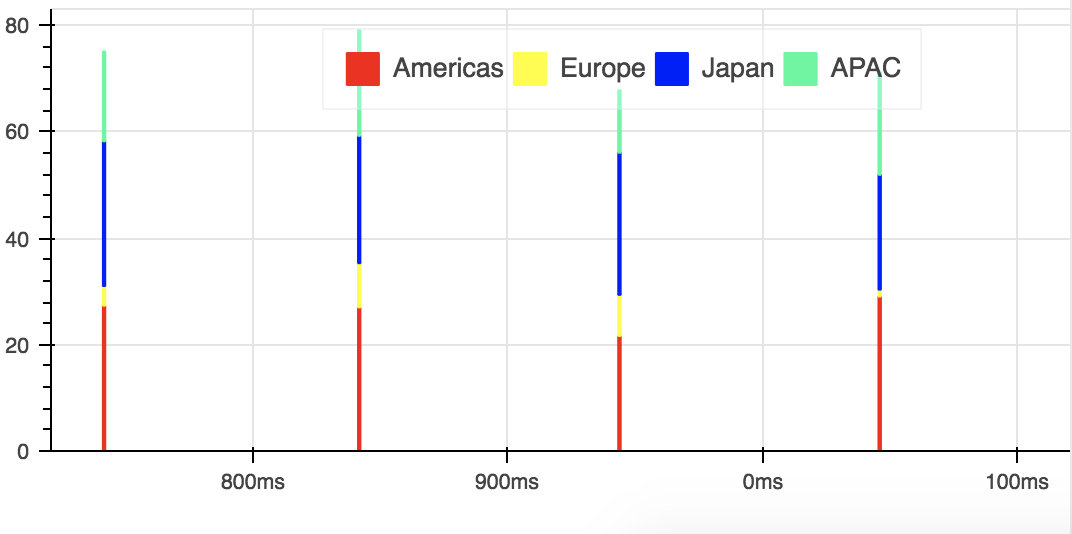
I’m trying vbar_stack with streaming data. The chart comes fine and streaming also happens without any issue, but v_bar width of 0.9 is not getting applied and it’s coming as a line. Could anyone help find what’s causing this?
myFigure.vbar_stack(regions, x=‘time’, width=.9, color=colors, source=regionSource,legend=[value(x) for x in regions])
On Sep 28, 2018, at 10:42, Venugopal Madathil <[email protected]> wrote:
I'm trying vbar_stack with streaming data. The chart comes fine and streaming also happens without any issue, but v_bar width of 0.9 is not getting applied and it's coming as a line. Could anyone help find what's causing this?
myFigure.vbar_stack(regions, x='time', width=.9, color=colors, source=regionSource,legend=[value(x) for x in regions])
On Sep 28, 2018, at 10:42, Venugopal Madathil [email protected] wrote:
I’m trying vbar_stack with streaming data. The chart comes fine and streaming also happens without any issue, but v_bar width of 0.9 is not getting applied and it’s coming as a line. Could anyone help find what’s causing this?
myFigure.vbar_stack(regions, x=‘time’, width=.9, color=colors, source=regionSource,legend=[value(x) for x in regions])
PFA screenshot as well.
–
You received this message because you are subscribed to the Google Groups “Bokeh Discussion - Public” group.
To unsubscribe from this group and stop receiving emails from it, send an email to [email protected].