Bokeh with GMaps on Jupyter does not change until zooming on browser

When running the following snippet:


from __future__ import print_function

from bokeh.models import (GMapPlot, Range1d, GMapOptions)

from bokeh.resources import INLINE

from bokeh.io import output_notebook

from bokeh.plotting import figure, show

output_notebook(resources=INLINE)

# JSON style string taken from: https://snazzymaps.com/style/1/pale-dawn

map_options = GMapOptions(lat=30.2861, lng=-97.7394, map_type="roadmap", zoom=13, styles="""

[{"featureType":"administrative","elementType":"all","stylers":[{"visibility":"on"},{"lightness":33}]},{"featureType":"landscape","elementType":"all","stylers":[{"color":"#f2e5d4"}]},{"featureType":"poi.park","elementType":"geometry","stylers":[{"color":"#c5dac6"}]},{"featureType":"poi.park","elementType":"labels","stylers":[{"visibility":"on"},{"lightness":20}]},{"featureType":"road","elementType":"all","stylers":[{"lightness":20}]},{"featureType":"road.highway","elementType":"geometry","stylers":[{"color":"#c5c6c6"}]},{"featureType":"road.arterial","elementType":"geometry","stylers":[{"color":"#e4d7c6"}]},{"featureType":"road.local","elementType":"geometry","stylers":[{"color":"#fbfaf7"}]},{"featureType":"water","elementType":"all","stylers":[{"visibility":"on"},{"color":"#acbcc9"}]}]

""")

# Google Maps now requires an API key. You can find out how to get one here:

# https://developers.google.com/maps/documentation/javascript/get-api-key

API_KEY = "AIzaSyDOESksOPLhqEwM-if1t2kNu8tdzbOevY4"

x_range = Range1d()

y_range = Range1d()

plot = figure()

plot = GMapPlot(

x_range=x_range, y_range=y_range,

map_options=map_options,

api_key=API_KEY,

)

show(plot)

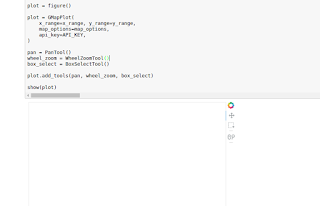
At the first instance, the output is blank white. (Pic 1).

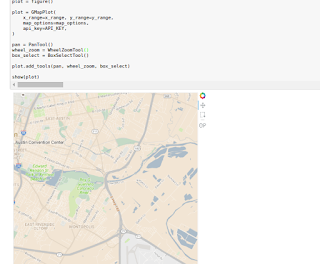
However after trying to zoom out on the page (Pic 2) it reappear again. Tried on both Chrome and Firefox.

What is happening?
You have also posted this as a bokeh issue - suggest we discuss
there - it does look like a bug - but there are a known issues
with GMapPlot in Jupyter notebooks.

···

On 8/24/16 11:36 AM, Quang Ha wrote:

When running the following snippet:

from future import print_function

from bokeh.models import (GMapPlot, Range1d, GMapOptions)

from bokeh.resources import INLINE

from bokeh.io import output_notebook

from bokeh.plotting import figure, show

output_notebook(resources=INLINE)

JSON style string taken from:

      map_options = GMapOptions(lat=30.2861, lng=-97.7394,

map_type=“roadmap”, zoom=13, styles=“”"

[{“featureType”:“administrative”,“elementType”:“all”,“stylers”:[{“visibility”:“on”},{“lightness”:33}]},{“featureType”:“landscape”,“elementType”:“all”,“stylers”:[{“color”:“#f2e5d4”}]},{“featureType”:“poi.park”,“elementType”:“geometry”,“stylers”:[{“color”:“#c5dac6”}]},{“featureType”:“poi.park”,“elementType”:“labels”,“stylers”:[{“visibility”:“on”},{“lightness”:20}]},{“featureType”:“road”,“elementType”:“all”,“stylers”:[{“lightness”:20}]},{“featureType”:“road.highway”,“elementType”:“geometry”,“stylers”:[{“color”:“#c5c6c6”}]},{“featureType”:“road.arterial”,“elementType”:“geometry”,“stylers”:[{“color”:“#e4d7c6”}]},{“featureType”:“road.local”,“elementType”:“geometry”,“stylers”:[{“color”:“#fbfaf7”}]},{“featureType”:“water”,“elementType”:“all”,“stylers”:[{“visibility”:“on”},{“color”:“#acbcc9”}]}]

“”")

      # Google Maps now requires an API key. You can find out how

to get one here:

API_KEY = “AIzaSyDOESksOPLhqEwM-if1t2kNu8tdzbOevY4”

x_range = Range1d()

y_range = Range1d()

plot = figure()

plot = GMapPlot(

x_range=x_range, y_range=y_range,

map_options=map_options,

api_key=API_KEY,

)

show(plot)

      At the first instance, the output is blank white. (*Pic

1*).

      However after trying to zoom out on the page (*Pic 2*) it

reappear again. Tried on both Chrome and Firefox.

What is happening?

  You received this message because you are subscribed to the Google

Groups “Bokeh Discussion - Public” group.

  To unsubscribe from this group and stop receiving emails from it,

send an email to [email protected].

  To post to this group, send email to [email protected].

  To view this discussion on the web visit [https://groups.google.com/a/continuum.io/d/msgid/bokeh/ba3def66-87e9-4900-8ed1-428a9c1b0831%40continuum.io](https://groups.google.com/a/continuum.io/d/msgid/bokeh/ba3def66-87e9-4900-8ed1-428a9c1b0831%40continuum.io?utm_medium=email&utm_source=footer).

  For more options, visit [https://groups.google.com/a/continuum.io/d/optout](https://groups.google.com/a/continuum.io/d/optout).


Sarah Bird
Developer, Bokeh

    [
      ![Continuum Analytics](http://docs.continuum.io/_static/img/ContinuumWordmark.png)
    ](http://continuum.io)

https://snazzymaps.com/style/1/pale-dawnhttps://developers.google.com/maps/documentation/javascript/get-api-key

For what its worth, I’ve noticed a similar thing with DataTables in bokeh output webpages - they can appear blank until you scroll on them. Could it be a related issue?

···

On Wednesday, 24 August 2016 19:36:12 UTC+1, Quang Ha wrote:

When running the following snippet:

from future import print_function

from bokeh.models import (GMapPlot, Range1d, GMapOptions)

from bokeh.resources import INLINE

from bokeh.io import output_notebook

from bokeh.plotting import figure, show

output_notebook(resources=INLINE)

JSON style string taken from: https://snazzymaps.com/style/1/pale-dawn

map_options = GMapOptions(lat=30.2861, lng=-97.7394, map_type=“roadmap”, zoom=13, styles=“”"

[{“featureType”:“administrative”,“elementType”:“all”,“stylers”:[{“visibility”:“on”},{“lightness”:33}]},{“featureType”:“landscape”,“elementType”:“all”,“stylers”:[{“color”:“#f2e5d4”}]},{“featureType”:“poi.park”,“elementType”:“geometry”,“stylers”:[{“color”:“#c5dac6”}]},{“featureType”:“poi.park”,“elementType”:“labels”,“stylers”:[{“visibility”:“on”},{“lightness”:20}]},{“featureType”:“road”,“elementType”:“all”,“stylers”:[{“lightness”:20}]},{“featureType”:“road.highway”,“elementType”:“geometry”,“stylers”:[{“color”:“#c5c6c6”}]},{“featureType”:“road.arterial”,“elementType”:“geometry”,“stylers”:[{“color”:“#e4d7c6”}]},{“featureType”:“road.local”,“elementType”:“geometry”,“stylers”:[{“color”:“#fbfaf7”}]},{“featureType”:“water”,“elementType”:“all”,“stylers”:[{“visibility”:“on”},{“color”:“#acbcc9”}]}]

“”")

Google Maps now requires an API key. You can find out how to get one here:

https://developers.google.com/maps/documentation/javascript/get-api-key

API_KEY = “AIzaSyDOESksOPLhqEwM-if1t2kNu8tdzbOevY4”

x_range = Range1d()

y_range = Range1d()

plot = figure()

plot = GMapPlot(

x_range=x_range, y_range=y_range,

map_options=map_options,

api_key=API_KEY,

)

show(plot)

At the first instance, the output is blank white. (Pic 1).

However after trying to zoom out on the page (Pic 2) it reappear again. Tried on both Chrome and Firefox.

What is happening?
Sounds like it might
be - thanks for highlighting that
Will Kew - can you post more de tails on the issue:

···

https://github.com/bokeh/bokeh/issues/5028
On 8/25/16 8:22 AM, Will Kew wrote:

    For what its worth, I've noticed a similar thing

with DataTables in bokeh output webpages - they can appear blank
until you scroll on them. Could it be a related issue?

    On Wednesday, 24 August 2016 19:36:12 UTC+1, Quang Ha wrote:

When running the following snippet:

from future import print_function

          from bokeh.models import (GMapPlot, Range1d,

GMapOptions)

from bokeh.resources import INLINE

from bokeh.io import output_notebook

from bokeh.plotting import figure, show

output_notebook(resources=INLINE)

JSON style string taken from: https://snazzymaps.com/style/1/pale-dawn

          map_options = GMapOptions(lat=30.2861, lng=-97.7394,

map_type=“roadmap”, zoom=13, styles=“”"

[{“featureType”:“administrative”,“elementType”:“all”,“stylers”:[{“visibility”:“on”},{“lightness”:33}]},{“featureType”:“landscape”,“elementType”:“all”,“stylers”:[{“color”:“#f2e5d4”}]},{“featureType”:“poi.park”,“elementType”:“geometry”,“stylers”:[{“color”:“#c5dac6”}]},{“featureType”:“poi.park”,“elementType”:“labels”,“stylers”:[{“visibility”:“on”},{“lightness”:20}]},{“featureType”:“road”,“elementType”:“all”,“stylers”:[{“lightness”:20}]},{“featureType”:“road.highway”,“elementType”:“geometry”,“stylers”:[{“color”:“#c5c6c6”}]},{“featureType”:“road.arterial”,“elementType”:“geometry”,“stylers”:[{“color”:“#e4d7c6”}]},{“featureType”:“road.local”,“elementType”:“geometry”,“stylers”:[{“color”:“#fbfaf7”}]},{“featureType”:“water”,“elementType”:“all”,“stylers”:[{“visibility”:“on”},{“color”:“#acbcc9”}]}]

“”")

          # Google Maps now requires an API key. You can find out

how to get one here:

https://developers.google.com/maps/documentation/javascript/get-api-key

API_KEY = “AIzaSyDOESksOPLhqEwM-if1t2kNu8tdzbOevY4”

x_range = Range1d()

y_range = Range1d()

plot = figure()

plot = GMapPlot(

x_range=x_range, y_range=y_range,

map_options=map_options,

api_key=API_KEY,

)

show(plot)

          At the first instance, the output is blank white. (*Pic

1*).

          However after trying to zoom out on the page (*Pic 2*)

it reappear again. Tried on both Chrome and Firefox.

What is happening?

  You received this message because you are subscribed to the Google

Groups “Bokeh Discussion - Public” group.

  To unsubscribe from this group and stop receiving emails from it,

send an email to [email protected].

  To post to this group, send email to [email protected].

  To view this discussion on the web visit [https://groups.google.com/a/continuum.io/d/msgid/bokeh/15e4b298-76d0-4d35-a8f9-207d42c9cf9f%40continuum.io](https://groups.google.com/a/continuum.io/d/msgid/bokeh/15e4b298-76d0-4d35-a8f9-207d42c9cf9f%40continuum.io?utm_medium=email&utm_source=footer).

  For more options, visit [https://groups.google.com/a/continuum.io/d/optout](https://groups.google.com/a/continuum.io/d/optout).


Sarah Bird
Developer, Bokeh

    [
      ![Continuum Analytics](http://docs.continuum.io/_static/img/ContinuumWordmark.png)
    ](http://continuum.io)