Hello,
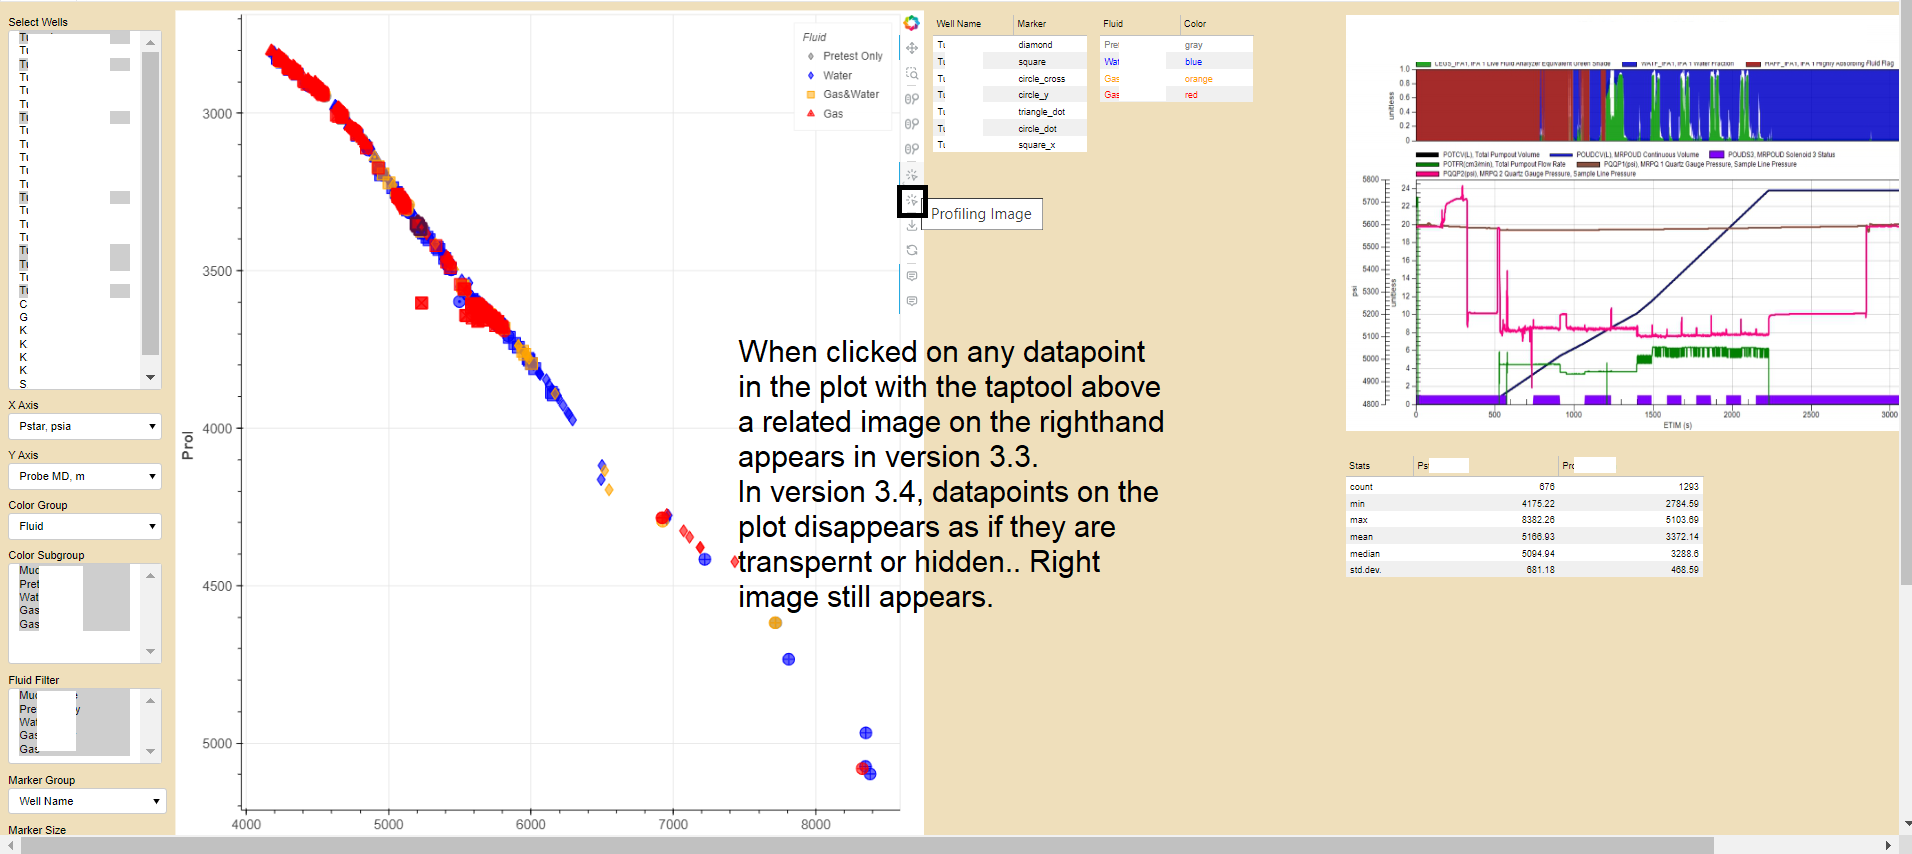
I plot scattered data points, which are clickable with taptool. When clicked on a point, a png image appears on the righthand. This is all good in Bokeh 3.3 and lower versions.
Now in Bokeh 3.4, the png image appears but data points in the plot disappear. Although when you hover with a mouse over the datapoint locations, hovertool shows tooltip related to the point as if point was there.
Installed back Bokeh 3.3. What has changed in the version3.4?
Thanks,
Köksal
Might be a bug, but we can’t investigate anything without a complete Minimal Reproducible Example.
E.g. it might be related to this, but there’s not enough information here to say for certain
This sounds extremely similar to an issue I had. If it’s the same issue, the cause is that the default action mode for the tap tool was changed in 3.4.0. This can be fixed by changing the taptool mode to replace, the previous default. More detail and a link to the change in my code is here: Dynamic figure problem with Bokeh v 3.4.0 udgrade - #6 by Bryan
Hope this helps
Hi there
I have a fully working version of the code with Bokeh 3.2.0.
I tried, as of today, Bokeh 3.4.1 and taptool problem still occurs in the code.
Is your solution released? How can I implement it?
By the way my code has the following script in both versions now:
…
p.add_tools(TapTool(description=“Pressure Gradient”, callback=update_slope_callback, mode=“replace”))
…
p.add_tools(TapTool(description=“Profiling Image”, renderers=[line_renderer], mode=“replace”))
…
Cheers, Köksal
My problem really looks like this!
[BUG] 3.4.0: Selection glyph no longer employs selection_glyph properties #13803, which uses taptool as well as Scatter:
I have several tabs in the app: Both tabs have similar problems but related pretty much same issue:
#A snippet for another tab in my code:
    p_tab2 = figure( width=2038, height=1016, x_range=(31.15, 31.3703), y_range=(42.81, 42.90))
    p_tab2_line_renderer =p_tab2.scatter(x='y',y='x', alpha=1.0, fill_alpha=0.6, size=20, color="dot_color", line_width=1.2,  source=source_info)
    p_tab2_selected_scatter = Scatter(fill_alpha=0.6, fill_color="dot_color", line_color="crimson", line_width=3)
    p_tab2_nonselected_scatter = Scatter(fill_alpha=0.6, fill_color="dot_color", line_color="black", line_width=1.2)
    p_tab2_line_renderer.selection_glyph = p_tab2_selected_scatter
    p_tab2_line_renderer.nonselection_glyph = p_tab2_nonselected_scatter

    p_tab2_labels = LabelSet(x='y',y='x', text='Name', source=source_info, text_font_size="12pt",text_font_style="bold",
                                        x_offset='x_offset_prog', y_offset='y_offset_prog', text_color='text_color')

    #p_tab2.add_layout(colorbar, "right")
    p_tab2.add_layout(p_tab2_labels)


#Another snippet for other tab:
    p = figure(tools=["save, pan, box_zoom, reset, wheel_zoom, xwheel_zoom, ywheel_zoom"], width = 900, height = 1015)


    line_renderer =p.scatter(x=xx, y=yy, alpha=1.0,  source=src, fill_alpha=0.5, size='Size', legend_field='legend',
               marker='marker', color='color', line_color='color', line_width=1.1 )

    selected_scatter = Scatter(fill_alpha=0.6, fill_color="color", line_color="#580F41", line_width=3)
    nonselected_scatter = Scatter(fill_alpha=0.6, fill_color="color", line_color="color", line_width=1.2)
    line_renderer.selection_glyph = selected_scatter
    line_renderer.nonselection_glyph = nonselected_scatter

    strip_renderer = p.hstrip(y0='y0', y1='y1', source=source2, fill_alpha=0.05, fill_color='color', line_color='color', line_alpha=0.8)
    strip_renderer.visible=False;
    strip_hover = HoverTool(description="Perforation Info",  line_policy='interp', point_policy='follow_mouse', tooltips=  [ ( "Subzone Perf",'@{well_zone}'), ("Top MD, m", '@{y0}{0.2f}'),
                    ("Bottom MD,m", '@{y1}{0.2f}'),('Thickness MD, m', '@{thickness}{0.2f}')],      mode='mouse', renderers=[strip_renderer])

    perf_labels=LabelSet(x=20, y='top_dephts', text='names',  x_offset=5, y_offset=-14, source=source1, x_units='screen', text_font_size='12px', text_color='black')
    perf_labels.visible=False

    slope = Slope(gradient=1, y_intercept=0, line_alpha=.6, line_width=5)
    p.add_layout(slope)
    # Create Slope renderers for additional lines
    slope_line1 = Slope(gradient=1.5, y_intercept=0, line_color="blue", line_dash="dashed", line_width=2)
    slope_line2 = Slope(gradient=2.0, y_intercept=0, line_color="red", line_dash="dashed", line_width=2)

    slope_line1.visible=False; slope_line2.visible=False; slope.visible=False;

    # Add Slope renderers to the plot
    p.add_layout(slope_line1)
    p.add_layout(slope_line2)

    # Hover tool with vline mode
    line_hover = HoverTool(description="Station Info", tooltips=
              [('Well', '@{Well Name}'),("X,Y", "$snap_x{0.2f}, $snap_y{0.2f}"),
               ('MD, m', '@{Probe MD, m}{0.2f}'),('Pf, psia', '@{Formation Pres., psia}{0.2f}'),('P*, psia', '@{Pstar, psia}{0.2f}'),
               ('Mob, md/cp', '@{DD Mobility, mD/cP}{0.2f}'),('kh, md', '@{kh, md}{0.2f}'),('Fluid', '@Fluid'),('Reservoir', '@Reservoir,@Reservoir_Sub'),
               ('File No', '@{File ID}'),('Logging', '@Logging')],
              mode='mouse', point_policy='follow_mouse', renderers=[line_renderer])
The PR that documents my code change is here: Fix dynamic reports with bokeh 3.4.0 problems by handwerkerd · Pull Request #1068 · ME-ICA/tedana · GitHub It looks like you might have already implemented something similar, so there might be something else going on in your code. I’m a bokeh novice & not sure I can help much more. --Dan
I believe that I solved the problem by changing Scatter to:
p_area = figure( width=2038, height=1016, x_range=(31.125, 31.3903), y_range=(42.81, 42.90), active_scroll =“wheel_zoom”, active_drag =“pan”)
p_area_labels = LabelSet(x=‘x’,y=‘y’, text=‘Name’, source=source_info, text_font_size=“12pt”,text_font_style=“bold”,
x_offset=‘x_offset_prog’, y_offset=‘y_offset_prog’, text_color=‘text_color’)
p_area_line_renderer =p_area.scatter(x='x',y='y', alpha=1.0, fill_alpha=0.6, size=20, color="stat_color", line_color="phase_color", line_width=3.,  source=source_info,

# set visual properties for selected glyphs
selection_color="stat_color",
selection_fill_alpha=1.0,
selection_line_color="phase_color",
selection_line_alpha=1.0,
selection_line_width=7.,

# set visual properties for non-selected glyphs
nonselection_color="stat_color",
nonselection_fill_alpha=1.0,
nonselection_line_color="phase_color",
nonselection_line_alpha=1.0,
nonselection_line_width=3.
)
Scatter (written with capitol letter), however, still gives the similar error… I achieve all this with Bokeh 3.5. Thanks and Regards, Koksal
#p_area.add_layout(colorbar, "right")
p_area.add_layout(p_area_labels)
This topic was automatically closed 90 days after the last reply. New replies are no longer allowed.