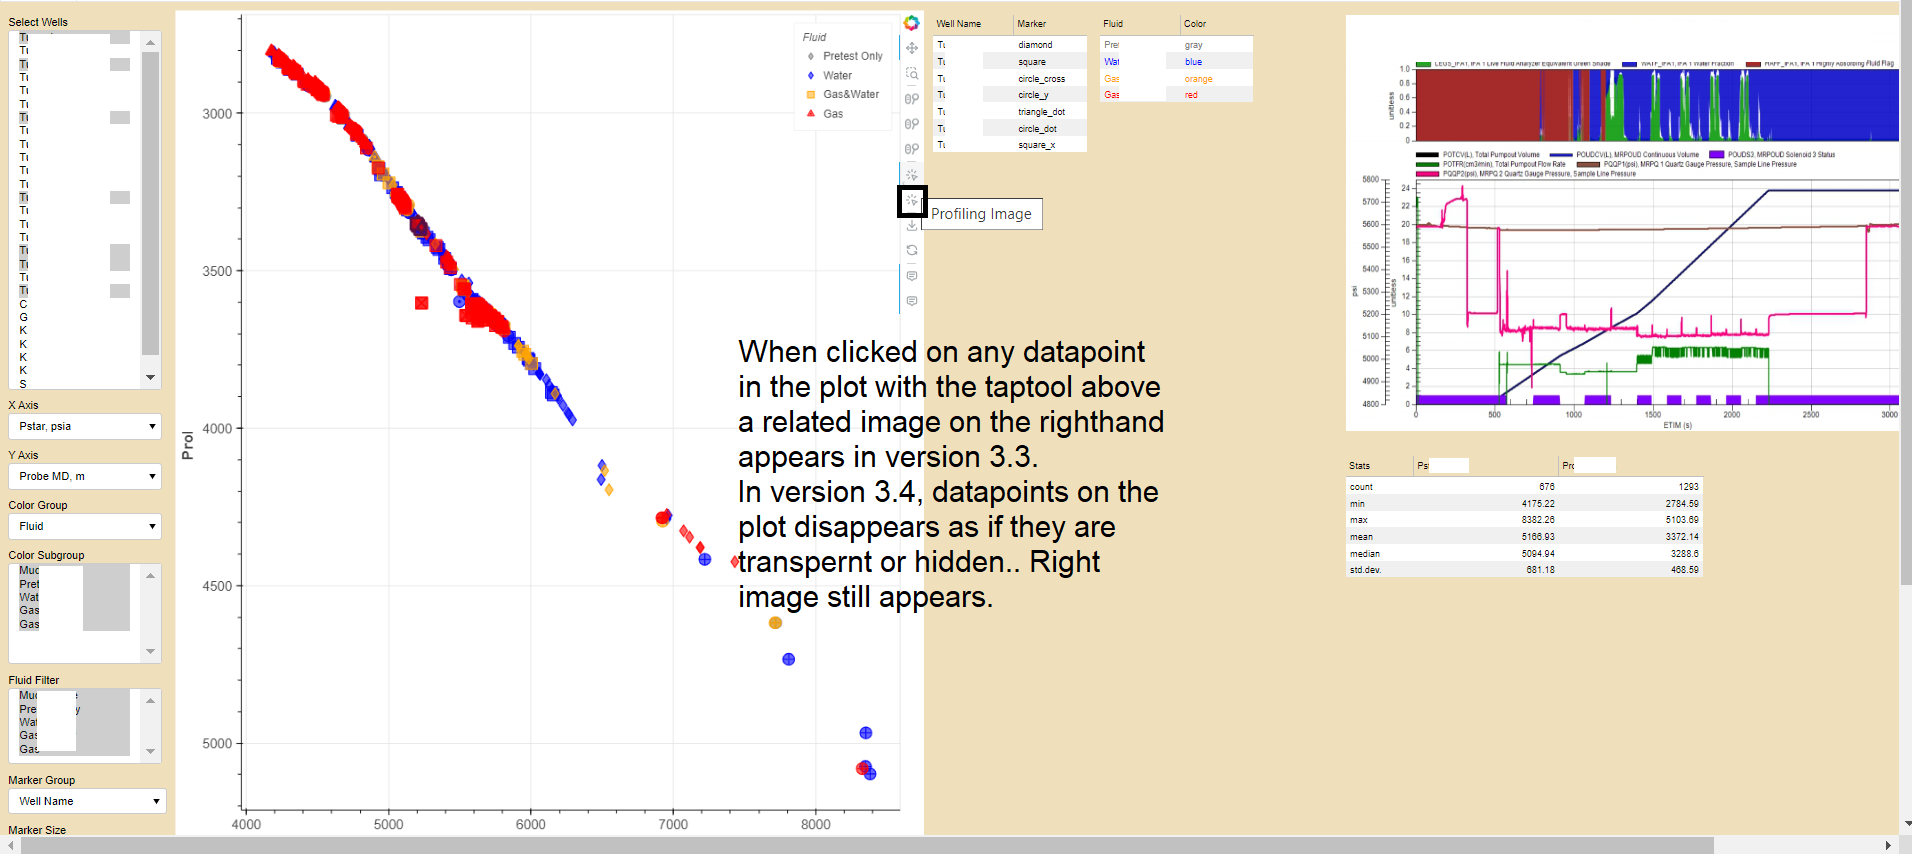
My problem really looks like this!
[BUG] 3.4.0: Selection glyph no longer employs selection_glyph properties #13803, which uses taptool as well as Scatter:
I have several tabs in the app: Both tabs have similar problems but related pretty much same issue:
#A snippet for another tab in my code:
    p_tab2 = figure( width=2038, height=1016, x_range=(31.15, 31.3703), y_range=(42.81, 42.90))
    p_tab2_line_renderer =p_tab2.scatter(x='y',y='x', alpha=1.0, fill_alpha=0.6, size=20, color="dot_color", line_width=1.2,  source=source_info)
    p_tab2_selected_scatter = Scatter(fill_alpha=0.6, fill_color="dot_color", line_color="crimson", line_width=3)
    p_tab2_nonselected_scatter = Scatter(fill_alpha=0.6, fill_color="dot_color", line_color="black", line_width=1.2)
    p_tab2_line_renderer.selection_glyph = p_tab2_selected_scatter
    p_tab2_line_renderer.nonselection_glyph = p_tab2_nonselected_scatter

    p_tab2_labels = LabelSet(x='y',y='x', text='Name', source=source_info, text_font_size="12pt",text_font_style="bold",
                                        x_offset='x_offset_prog', y_offset='y_offset_prog', text_color='text_color')

    #p_tab2.add_layout(colorbar, "right")
    p_tab2.add_layout(p_tab2_labels)


#Another snippet for other tab:
    p = figure(tools=["save, pan, box_zoom, reset, wheel_zoom, xwheel_zoom, ywheel_zoom"], width = 900, height = 1015)


    line_renderer =p.scatter(x=xx, y=yy, alpha=1.0,  source=src, fill_alpha=0.5, size='Size', legend_field='legend',
               marker='marker', color='color', line_color='color', line_width=1.1 )

    selected_scatter = Scatter(fill_alpha=0.6, fill_color="color", line_color="#580F41", line_width=3)
    nonselected_scatter = Scatter(fill_alpha=0.6, fill_color="color", line_color="color", line_width=1.2)
    line_renderer.selection_glyph = selected_scatter
    line_renderer.nonselection_glyph = nonselected_scatter

    strip_renderer = p.hstrip(y0='y0', y1='y1', source=source2, fill_alpha=0.05, fill_color='color', line_color='color', line_alpha=0.8)
    strip_renderer.visible=False;
    strip_hover = HoverTool(description="Perforation Info",  line_policy='interp', point_policy='follow_mouse', tooltips=  [ ( "Subzone Perf",'@{well_zone}'), ("Top MD, m", '@{y0}{0.2f}'),
                    ("Bottom MD,m", '@{y1}{0.2f}'),('Thickness MD, m', '@{thickness}{0.2f}')],      mode='mouse', renderers=[strip_renderer])

    perf_labels=LabelSet(x=20, y='top_dephts', text='names',  x_offset=5, y_offset=-14, source=source1, x_units='screen', text_font_size='12px', text_color='black')
    perf_labels.visible=False

    slope = Slope(gradient=1, y_intercept=0, line_alpha=.6, line_width=5)
    p.add_layout(slope)
    # Create Slope renderers for additional lines
    slope_line1 = Slope(gradient=1.5, y_intercept=0, line_color="blue", line_dash="dashed", line_width=2)
    slope_line2 = Slope(gradient=2.0, y_intercept=0, line_color="red", line_dash="dashed", line_width=2)

    slope_line1.visible=False; slope_line2.visible=False; slope.visible=False;

    # Add Slope renderers to the plot
    p.add_layout(slope_line1)
    p.add_layout(slope_line2)

    # Hover tool with vline mode
    line_hover = HoverTool(description="Station Info", tooltips=
              [('Well', '@{Well Name}'),("X,Y", "$snap_x{0.2f}, $snap_y{0.2f}"),
               ('MD, m', '@{Probe MD, m}{0.2f}'),('Pf, psia', '@{Formation Pres., psia}{0.2f}'),('P*, psia', '@{Pstar, psia}{0.2f}'),
               ('Mob, md/cp', '@{DD Mobility, mD/cP}{0.2f}'),('kh, md', '@{kh, md}{0.2f}'),('Fluid', '@Fluid'),('Reservoir', '@Reservoir,@Reservoir_Sub'),
               ('File No', '@{File ID}'),('Logging', '@Logging')],
              mode='mouse', point_policy='follow_mouse', renderers=[line_renderer])