BokehJS: How can I add an image to plot title?

Library Version:
BokehJS with version: 3.0.3

What we are attempting to do:
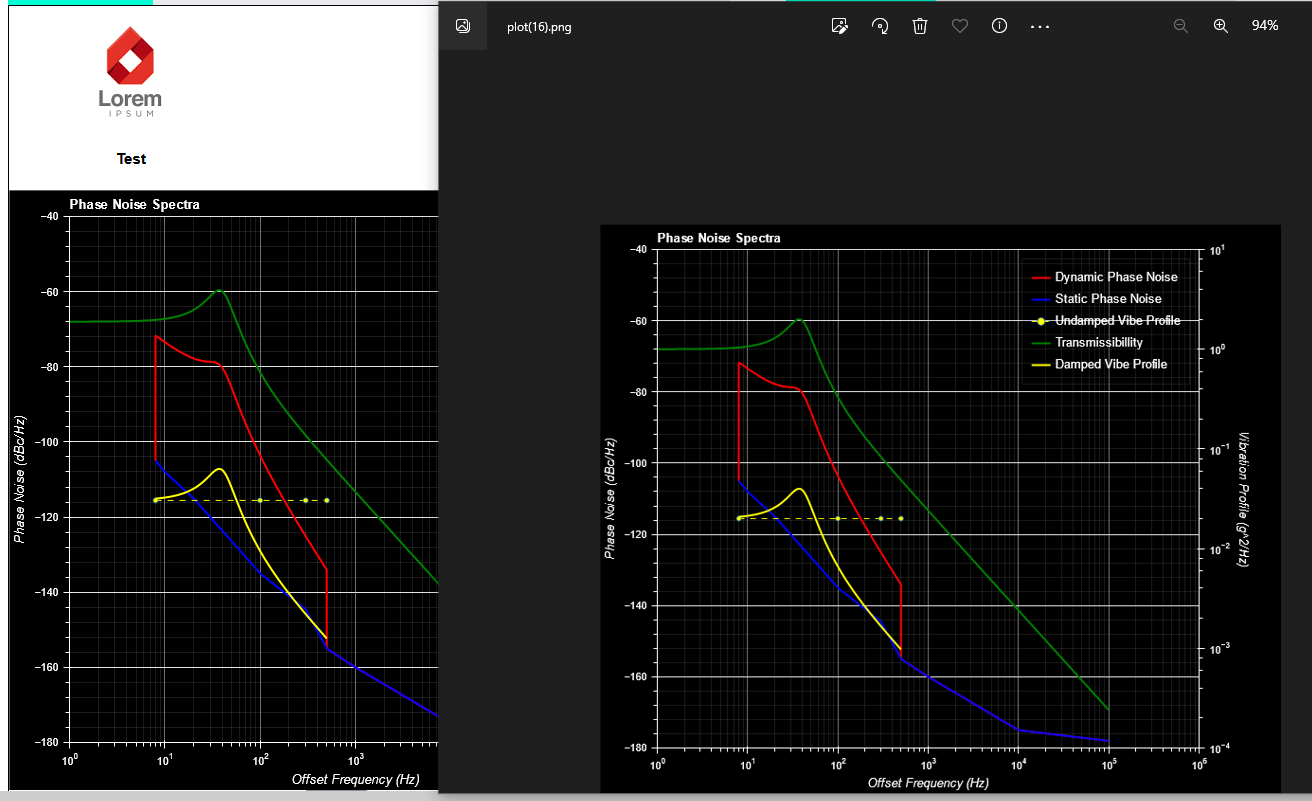
I’m trying to add our company’s logo to the title of our generated graph.
We want to add the image into the title and then also have the title. Eg. “ This is a title”
Basically, need someway to add a HTML element to the title.

I see there is a Bokeh.title as well as a Bokeh.HTMLTitle model.

I’ve tried:
1. Just adding the image into the title when creating the plot

var plot = Bokeh.Plotting.figure({
        title: "<img src='https://upload.wikimedia.org/wikipedia/commons/2/24/LEGO_logo.svg' alt='Logo'> Phase Noise Spectra",
        tools: "pan,wheel_zoom,box_zoom,reset",
        toolbar_location: "right",
        toolbar_sticky: false,
        x_range: [1, 1000000],
        x_axis_type: "log",
        x_axis_label: "Offset Frequency (Hz)",
        y_range: [-180, -40],
        y_axis_type: "linear",
        y_axis_label: "Phase Noise (dBc/Hz)",
        extra_y_ranges: { "y2_range": y2_range },
        extra_y_scales: { "y2_range": new Bokeh.LogScale() },
        resizable: true,
        width_policy: "max", //makes graph grow to fit the div exactly
    });

Result: Just gives the tag as text

2. Creating a HTMLTitle object and using that as the title:

var plot = Bokeh.Plotting.figure({
        title: "Phase Noise Spectra",
        tools: "pan,wheel_zoom,box_zoom,reset",
        toolbar_location: "right",
        toolbar_sticky: false,
        x_range: [1, 1000000],
        x_axis_type: "log",
        x_axis_label: "Offset Frequency (Hz)",
        y_range: [-180, -40],
        y_axis_type: "linear",
        y_axis_label: "Phase Noise (dBc/Hz)",
        extra_y_ranges: { "y2_range": y2_range },
        extra_y_scales: { "y2_range": new Bokeh.LogScale() },
        resizable: true,
        width_policy: "max", //makes graph grow to fit the div exactly
    });

    //Configure some Plot options
    let test_title = new Bokeh.HTMLTitle({
        text: "<img src='https://upload.wikimedia.org/wikipedia/commons/2/24/LEGO_logo.svg' alt='Logo'>",
        align: "center"
    });
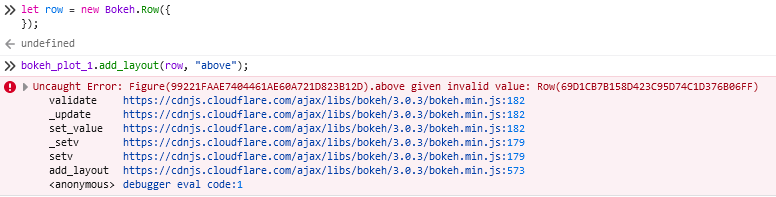
    plot.add_layout(test_title, "above");

Result: The tag doesn’t render and just displays as text


When viewing this result in a browser and inspecting the HTML, I see the source for the created HTMLTitle:
The img tag is formatted exactly how all tags are but gets rendered as text instead of a tag

3.
Same as attempt 2 but wrapped the img tag in a div tag.
Same result as attempt 2

Question:
How can I make it so that we can add a logo to the plot title as above?

Question:
We were also considering just putting our logo where the Bokeh logo is by default on the toolbar.
Is this okay wrt to Bokeh guidelines/license?
This may have to be our solution if we cannot add the logo to the title

Thanks

Titles are drawn on the canvas using HTML canvas text APIs, so there is no way to put an image in actual plot titles. A workaround would be to put a Div above the plot (e.g. in a column or other layout), and use the Div to act as a “title”, since it can contain whatever arbitrary HTML you like.

We don’t have any requirements to display the logo [1], it is possible to set toolbar.logo = None to hide the Bokeh logo. I’m not sure offhand how you could replace it with a different image, but I’m sure that’s possible somehow.


  1. We certainly appreciate when users do leave it in place, of course. ↩︎

Thanks for the quick reply.

Re the workaround:
Is there a way to create the div above the plot with Bokeh models, and have the image render?
We need the logo/title to be part of the plot itself, as we need the logo present when the plot is saved/downloaded by the user.

Attempt:
I was trying to create it with Bokeh.Row or Column

let row = new Bokeh.row{(
    children: x
});

where x is various components I tried to add.
I tried adding a html div, html img tag, some bokeh widgets, string.
All give the same error:

Uncaught Error: Row(9983298067274972938C337C51BB6D90).children given invalid value: "Hi"

Then also when trying to add the layout, this error occurs:

Question:
If this is possible to do, how would I go about adding the title img/text to a row/column, and then in turn use add_layout() to add that to the plot?

Re: toolbar logo.
Just so you know: it looks like the logo is just set with a css background-image attribute so is very easily changeable.
Hoping to get the logo working in title so we can not remove/replace the Bokeh logo

Thanks

AFAIK this would also be the only way to embed an image in the Div without using a <img> tag

The children of the Row needs to be a list of Bokeh objects. In this case, a list with the Div and the plot.

And you would not use add_layout on the plot. That function is only for adding things that live on the HTML canvas, which a div does not. Instead, you would embed the Row object (which has the div and plot inside) instead of embedding the plot object. I am afraid I don’t have a pure BokehJS example to share, but here is a similar Python example you can refer to:

This example puts a div under the plot, but the idea is exactly the same.

Thanks, this helped a lot, I managed to get the plot in the row/column and display it.


    let row = new Bokeh.Column({
        children: [plot],
        sizing_mode: "stretch_width"
    });
    Bokeh.Plotting.show(row, "#" + graph_location);

But I can’t figure out how to create the Bokeh Div, I see from the python version it’s Bokeh.models.Div, this exact class doesnt exist in BokehJS.
I had a look around at all of BokehJS and the only place I could see it was Bokeh.Models._known_models which is a map of all the models,
entry for div: 275: "bokeh.models.dom.Div" → class D {}
Can’t figure out how to call the constructor for it.

Question:
How do I call the constructor to create the Bokeh div element?

There are multiple resource bundles. To use widgets, you will need to also include the separate bokeh-widgets-x.y.x.min.js which has (most of) the widgets. After that, bokeh.models.Div will be available.

Thanks,
I already had the CDN loaded, I just had to call it with Bokeh.Widgets.Div not Bokeh.Models

I’m now trying to save the plot

save_plot_button(.export(), "plot");};
async function save_plot_button(plot, name){
    plot = Object.values(Bokeh.index)[num_created_bokeh].export(); //[0]
    const blob = await plot.to_blob();
    const link = document.createElement("a");
    link.href = URL.createObjectURL(blob);
    link.download = name; // + ".png" | "svg" (inferred from MIME type)
    link.target = "_blank";
    link.dispatchEvent(new MouseEvent("click"));
}

plot refers to the column I created, I checked and it’s the 0th element in Bokeh.index.
The plot and div itself are not seperatley in the Bokeh.index.
The picture I’m adding to the column is a png.
When I save the plot, it doesnt save the div, it only saves the plot itself.

Putting the logo at the top of the plot, then saving gives this:
Looks like space is taken up for the div but it doesn’t show up on the saved png.

Question:
Is there a way to save it with the div as well? Or is it just not possible?

Not with the save tool. All the save tool does is to dump the raw HTML canvas RGBA pixel data as an image. It cannot capture anything outside the canvas. (Note: this includes the toolbar, since the toolbar is a DOM element that is just absolutely positioned on top of the canvas)

The Python API has export_png which can export entire layouts (including Div, etc) as PNG but those APIs drive a headless browser with Selenium to more or less just take a screenshot. I am not sure how you can do this from pure JS. I think you would need to find some third-party JS library for screenshots, assuming that exists.

It sounds like you are after some sort of watermark? I don’t really have any great suggestions from a pure JS standpoint. You could put the watermark in the plot itself, so that the save tool can capture it, but of course you’ll have to take care to arrange things so that the watermark does not obscure the data. It’s also possible BokehJS is just not the best tool for your needs.

Ah I see how save tool works now.

I’m placing a canvas inside the above div which then I draw the logo and title on. I’m going to try to see if i can turn that into a blob as well and add it to the plot blob and save that. Seems like creating a new blob combining the two canvases, will only save the first element added to the new blob (I think because of how blob formats stuff. Gonna play around and see if theres a way.

I’m also thinking maybe I could create both the pngs from the canvases, but before downloading them, draw them both on a new canvas, and then save that canvas

I would think this is possible no? They can both be saved separately, there’s gotta be some obscure JS way of doing it.
And if not, it is what it is I guess, will have to find another way

BokehJS has been pretty great other than this issue. All the other issues were relatively easy to solve with your help.

Thanks for the amazing help as always

I do think tricks like this are probably possible, but may be a bit clunky. I definitely haven’t ever tried anything like this personally, which is the main reason I didn’t mention this direction. If you do get something working, please report back!

Its gotta be possible I think, I’m getting very close, but this is taking too long to solve, so we are just gonna go with a text instead of a logo.

This was my almost attempt:

//add logo/text to canvas
canvas = document.querySelector("div#graph1-loc.graph div.bk-Column").shadowRoot.querySelector("div.bk-Div").shadowRoot.querySelector("div.bk-clearfix canvas");
canvas_ctx = canvas.getContext("2d");
canvas_ctx.fillText("Hello There", 10, 50);

//get blob for plot
plot_blob = await Object.values(Bokeh.index)[0].export().to_blob();

function blobToDataURL(blob, callback) {
    var a = new FileReader();
    a.onload = function(e) {callback(e.target.result);}
    a.readAsDataURL(blob);
}

//convert plot blob to data url
blobToDataURL(plot_blob, function(dataurl){
    console.log(dataurl);
	plot_url = dataurl;
});

//create new images in memory from the URLS
img1 = new Image;
img2 = new Image;
img1.src = canvas.toDataURL();
img2.src = plot_url;

//draw these images on a new canvas and display it
result = document.createElement("canvas");
result.style.height = "1000px";
result.style.width = "1000px";
document.getElementById("outer-grid-container").append(result);
ctx = result.getContext("2d");
ctx.drawImage(img1, 0, 0);
ctx.drawImage(img2, 500, 500);

//download new canvas as png
link = document.createElement("a");
link.href = result.toDataURL();
link.download = name; // + ".png" | "svg" (inferred from MIME type)
link.target = "_blank";
link.dispatchEvent(new MouseEvent("click"));

returns:
image
The downloaded file also looks the same as this picture.

Definitely somehow possible imo, will update here if i ever go back and manage to make it work.

Thanks

2 Likes

Perhaps bokeh.io.export_png is worth a try:

Export the UIElement object or document as a PNG.

Export_png doesn’t exist in BokehJS. I’m using a workaround for that (see my previous posts) to save the plot. IIRC it’s the same implementation as export_png is under the hood.

Appreciate the suggestion though.
Thanks

This topic was automatically closed 90 days after the last reply. New replies are no longer allowed.